组件

ECK

https://www.elastic.co/guide/en/cloud-on-k8s/2.0/k8s-install-helm.html

1
2
3
4
5
6
7
8
9
helm repo add elastic https://helm.elastic.co
helm repo update


helm fetch elastic/eck-operator-crds --version 2.0.0
helm fetch elastic/eck-operator --version 2.0.0

helm install elastic-operator-crds elastic/eck-operator-crds
helm install elastic-operator eck-operator-2.0.0.tgz -n elastic-system --create-namespace -f values.yaml

values.yaml

1
2
3
4
5
6
7
8
9
10
11
12
image:
  repository: harbor.xx.cn:20000/eck/eck-operator

config:
  containerRegistry: harbor.xx.cn:20000
  metricsPort: "10254"

podMonitor:
  enabled: true
  labels:
    "app": "eck"
                                                                                                                                 

image

1
2
3
docker.elastic.co/eck/eck-operator:2.0.0
docker.elastic.co/elasticsearch/elasticsearch:8.5.2
docker.elastic.co/kibana/kibana:8.5.2

创建Elasticsearch Kibana 实例

1
2
3
4
5
6
7
8
9
10
11
12
13
14
15
16
17
18
19
20
21
22
23
apiVersion: elasticsearch.k8s.elastic.co/v1
kind: Elasticsearch
metadata:
  name: quickstart
spec:
  version: 8.5.2
  nodeSets:
  - name: default
    count: 1
    config:
      node.store.allow_mmap: false

---

apiVersion: kibana.k8s.elastic.co/v1
kind: Kibana
metadata:
  name: quickstart
spec:
  version: 8.5.2
  count: 1
  elasticsearchRef:
    name: quickstart

kafka

1
2
quay.io/strimzi/operator:0.32.0
quay.io/strimzi/kafka:0.32.0-kafka-3.3.1

下载helm chart

1
helm install strimzi-kafka-operator strimzi-kafka-operator-helm-3-chart-0.32.0.tgz -n kafka --create-namespace -f values.yaml

values.yaml

1
defaultImageRegistry: harbor.xx.cn:20000
1
2
3
4
5
6
7
8
9
10
11
12
13
14
15
16
17
18
19
20
21
22
23
24
25
26
27
28
29
30
31
32
33
34
35
36
37
38
39
40
apiVersion: kafka.strimzi.io/v1beta2
kind: Kafka
metadata:
  name: my-cluster
spec:
  kafka:
    version: 3.3.1
    replicas: 1
    listeners:
      - name: plain
        port: 9092
        type: internal
        tls: false
      - name: tls
        port: 9093
        type: internal
        tls: true
    config:
      offsets.topic.replication.factor: 1
      transaction.state.log.replication.factor: 1
      transaction.state.log.min.isr: 1
      default.replication.factor: 1
      min.insync.replicas: 1
      inter.broker.protocol.version: "3.3"
    storage:
      type: jbod
      volumes:
      - id: 0
        type: persistent-claim
        size: 100Gi
        deleteClaim: false
  zookeeper:
    replicas: 1
    storage:
      type: persistent-claim
      size: 100Gi
      deleteClaim: false
  entityOperator:
    topicOperator: {}
    userOperator: {}

minio

修改集群配置,operator报错operator TLS secret not found: secrets “operator-tls” not found

1
2
3
4
5
services:
    kube-controller:
     extra_args:
      cluster-signing-cert-file: "/etc/kubernetes/ssl/kube-ca.pem"
      cluster-signing-key-file: "/etc/kubernetes/ssl/kube-ca-key.pem"

根据官方文档,不配置这个实际上operator不能正常启动。

镜像

1
2
3
minio/console:v0.22.5
minio/operator:v4.5.8
quay.io/minio/minio:RELEASE.2023-01-12T02-06-16Z

安装参考

1
2
3
4
5
6
7
8
helm repo add minio https://operator.min.io/

helm repo update

helm fetch minio/operator
helm fetch minio/tenant

helm install minio-operator  operator-4.5.8.tgz -n minio-operator --create-namespace

查看

1
2
3
4
5
6
7
8
9
10
11
12
13
kubectl get pod -n minio-operator

NAME                              READY   STATUS    RESTARTS   AGE
console-69b7fd5d6c-rswcz          1/1     Running   0          16h
minio-operator-847856595f-5lzw6   1/1     Running   0          16h
minio-operator-847856595f-8vbmf   1/1     Running   0          16h

# 创建 console svc 的nodeport
kubectl get svc -n minio-operator

NAME               TYPE        CLUSTER-IP      EXTERNAL-IP   PORT(S)                         AGE
console            ClusterIP   10.43.221.38    <none>        9090/TCP,9443/TCP               16h
operator           ClusterIP   10.43.128.186   <none>        4222/TCP                        16h

创建 console svc 的nodeport

1
2
3
4
5
6
7
8
9
10
11
12
13
14
15
apiVersion: v1
kind: Service
metadata:
  name: console-nodeport
  namespace: minio-operator
spec:
  ports:
  - name: http
    port: 9090
    protocol: TCP
    targetPort: 9090
  selector:
    app.kubernetes.io/instance: minio-operator-console
    app.kubernetes.io/name: operator
  type: NodePort

通过访问nodeport访问minio operator管理页面。token通过下面命令获取

1
2
# 获取登录token
kubectl -n minio-operator  get secret console-sa-secret -o jsonpath="{.data.token}" | base64 --decode

登录后

image-20230129144728759

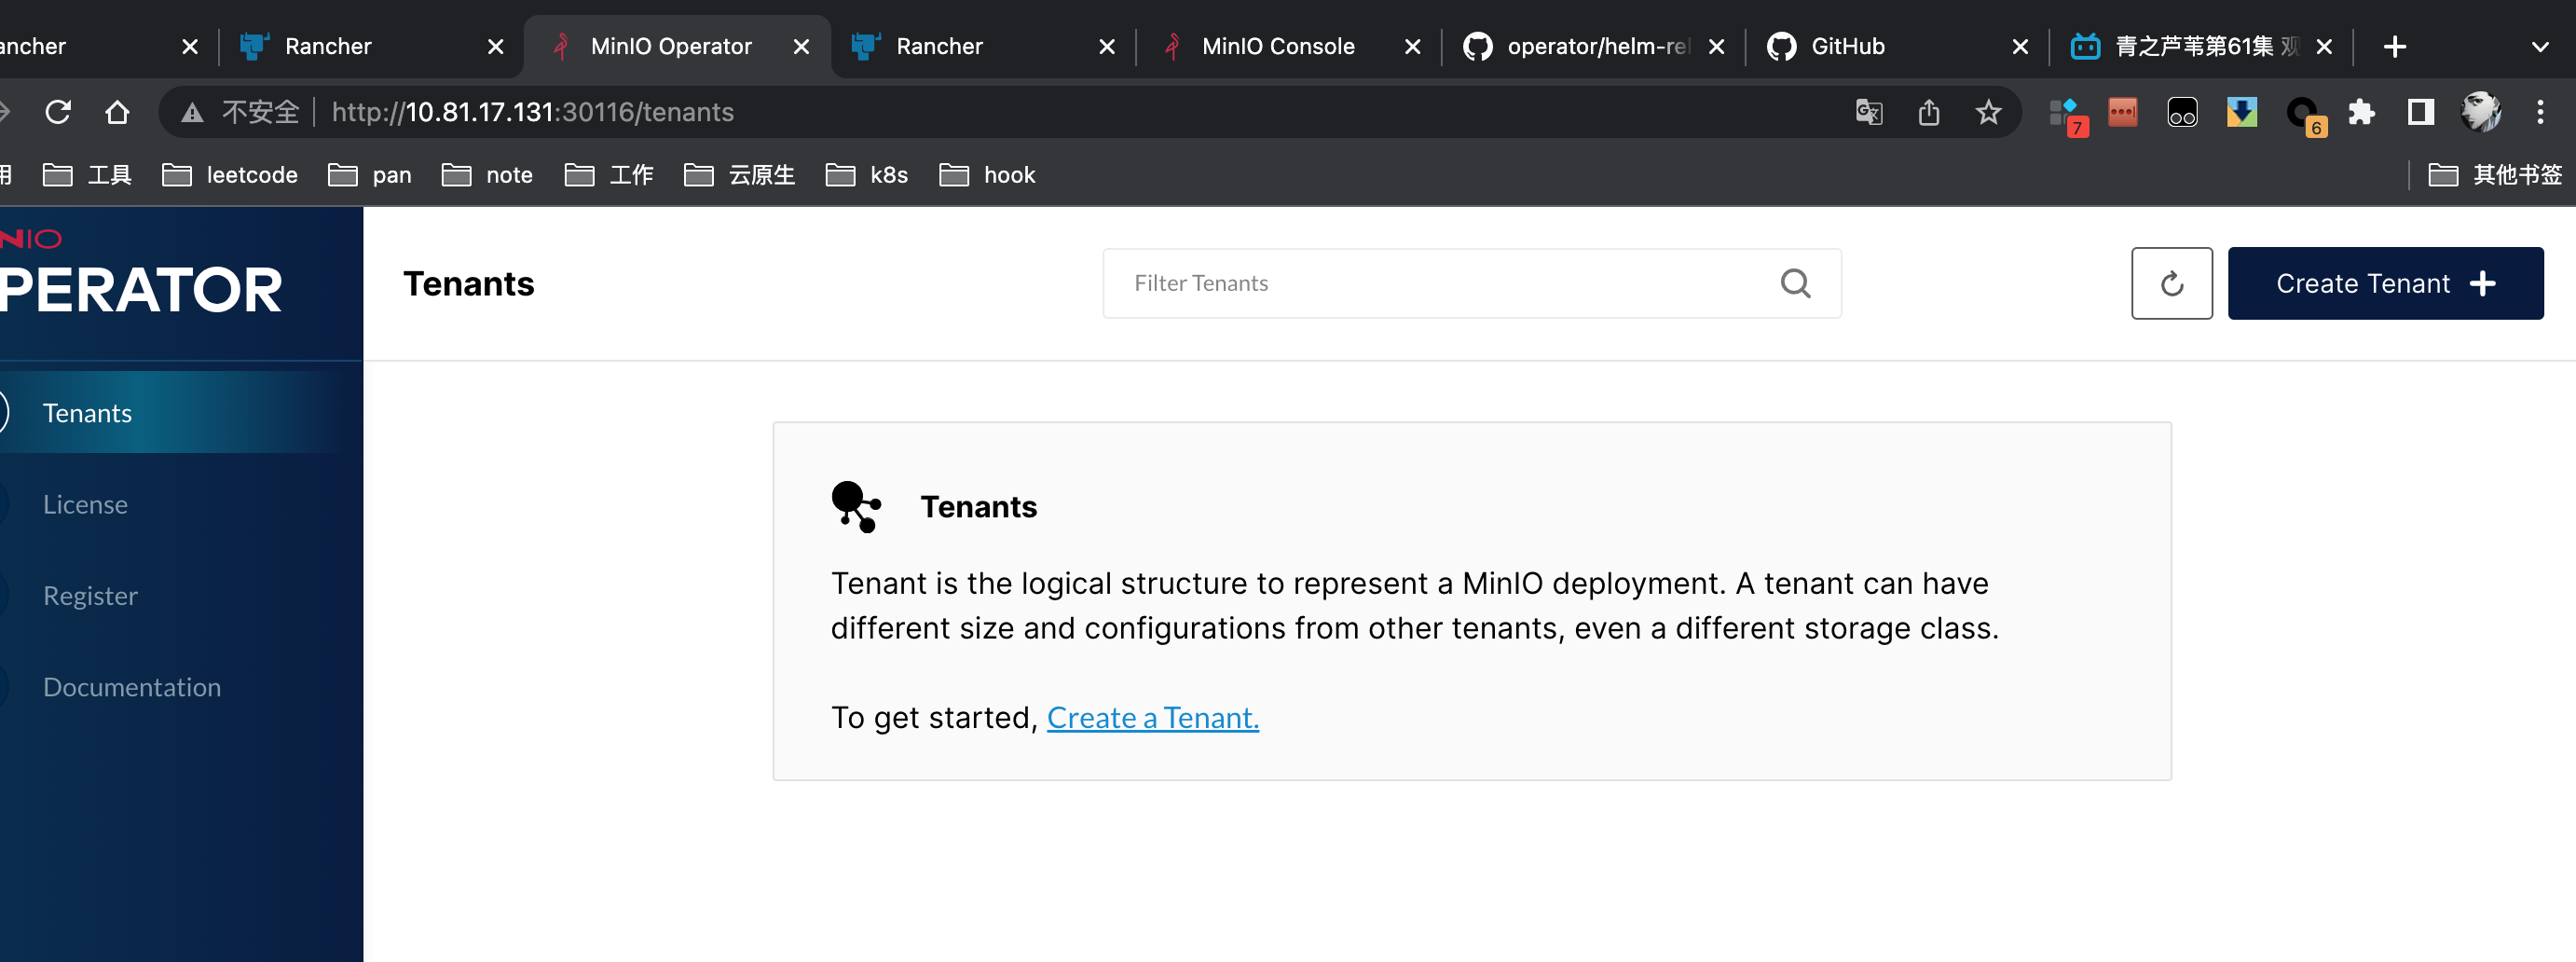
安装tenant, 一个tenant独占一个namespace

1
helm install --namespace minio-tenant1 --create-namespace tenant tenant-4.5.8.tgz -f tenant_values.yaml
1
2
3
4
5
6
7
8
9
10
11
12
13
14
15
16
17
18
19
20
21
22
23
24
25
26
27
28
29
30
31
32
33
34
35
36
37
secrets:
  name: minio1-env-configuration
  # MinIO root user and password
  accessKey: minio
  secretKey: minio123

tenant:
  # Tenant name
  name: minio1
  ## Registry location and Tag to download MinIO Server image
  image:
    repository: minio/minio

  ## Specification for MinIO Pool(s) in this Tenant.
  pools:
    ## Servers specifies the number of MinIO Tenant Pods / Servers in this pool.
    ## For standalone mode, supply 1. For distributed mode, supply 4 or more.
    ## Note that the operator does not support upgrading from standalone to distributed mode.
    - servers: 3
      ## custom name for the pool
      name: pool-0
      ## volumesPerServer specifies the number of volumes attached per MinIO Tenant Pod / Server.
      volumesPerServer: 2
      ## size specifies the capacity per volume
      size: 10Gi
      ## storageClass specifies the storage class name to be used for this pool
      storageClassName: openebs-hostpath

  prometheus:
    disabled: true
    storageClassName: openebs-hostpath
  log:
    disabled: true
    db:
      volumeClaimTemplate:
        spec:
          storageClassName: openebs-hostpath
1
2
3
4
5
6
7
8
9
10
11
12
13
14
15
16
kubectl get pvc -n minio-tenant1
NAME                    STATUS   VOLUME                                     CAPACITY   ACCESS MODES   STORAGECLASS       AGE
data0-minio1-pool-0-0   Bound    pvc-3536b4f0-9912-439a-b30c-1d3fd3a9fdb9   10Gi       RWO            openebs-hostpath   2m42s
data0-minio1-pool-0-1   Bound    pvc-eb8187ab-d8f0-4967-b963-06b366483fb3   10Gi       RWO            openebs-hostpath   2m42s
data0-minio1-pool-0-2   Bound    pvc-1c2d72a3-10ea-4ce2-b766-5b1c97f19c54   10Gi       RWO            openebs-hostpath   2m42s
data1-minio1-pool-0-0   Bound    pvc-a76ab485-0ff4-44eb-a6e5-29ef66224c0b   10Gi       RWO            openebs-hostpath   2m42s
data1-minio1-pool-0-1   Bound    pvc-067e7cf1-70f8-4970-a696-36fb13d8f42e   10Gi       RWO            openebs-hostpath   2m42s
data1-minio1-pool-0-2   Bound    pvc-e073b737-71e4-4983-9e1b-9eca1df5cc4e   10Gi       RWO            openebs-hostpath   2m42s


kubectl get pod -n minio-tenant1
NAME              READY   STATUS    RESTARTS   AGE
minio1-pool-0-0   1/1     Running   0          4m8s
minio1-pool-0-1   1/1     Running   0          4m8s
minio1-pool-0-2   1/1     Running   0          4m8s

Prometheus

创建ServiceMonitor

prometheus-operator guide

prometheus官方expoter

Ingress-nginx

https://kubernetes.github.io/ingress-nginx/user-guide/monitoring/

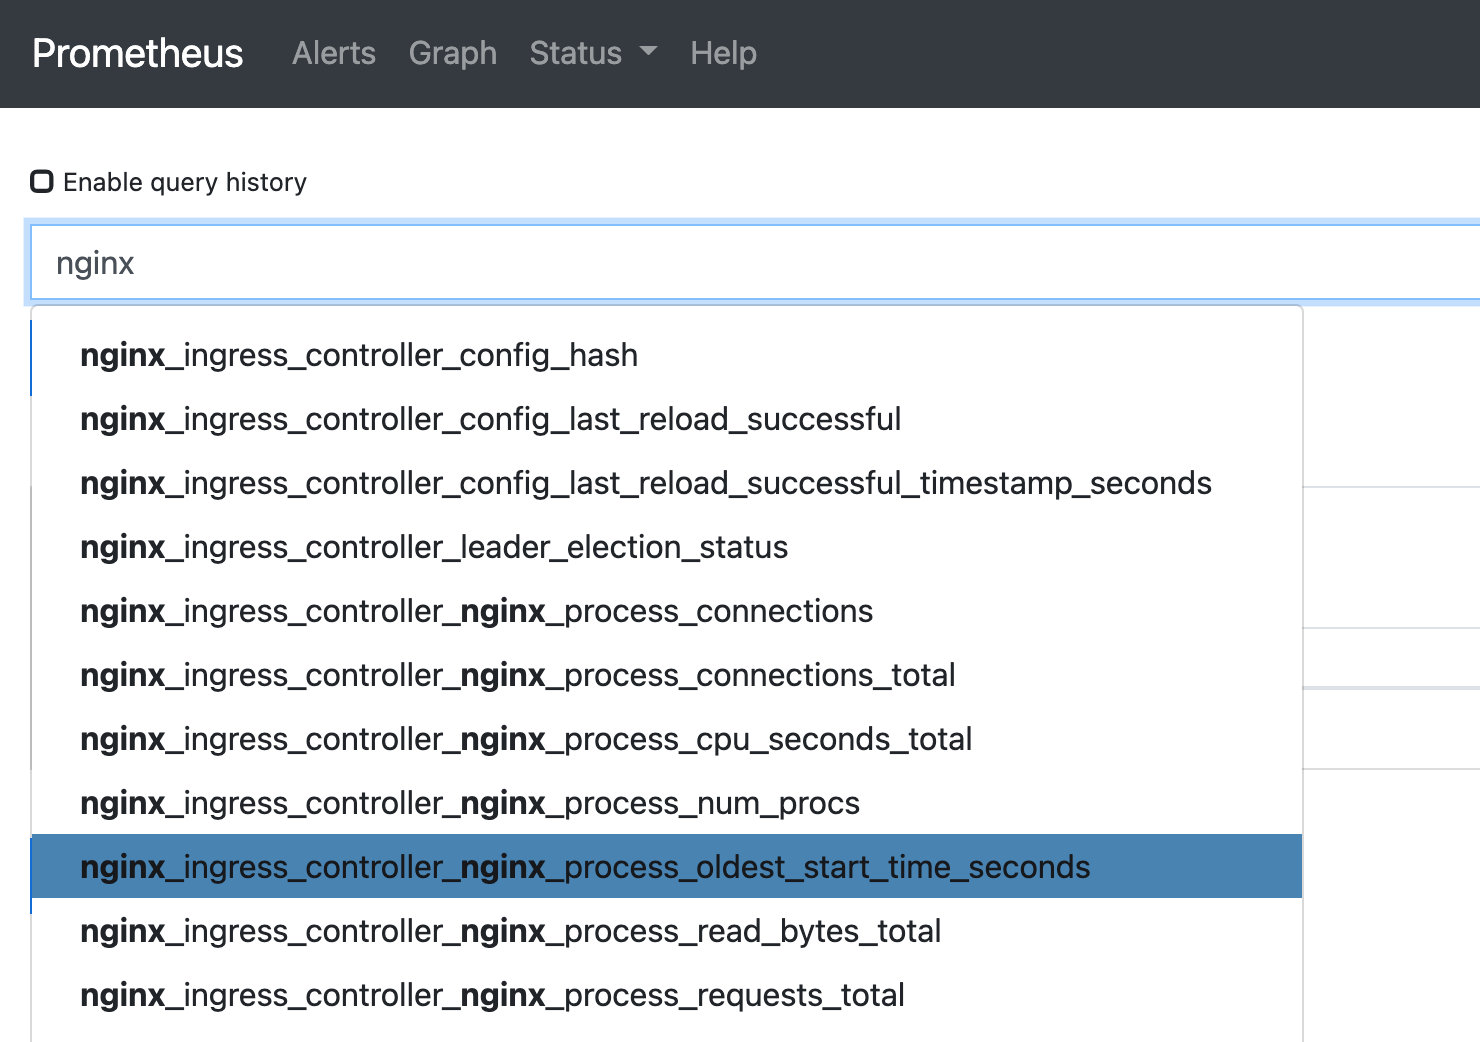
修改nginx-ingress-controller

1
2
3
4
5
6
7
8
9
10
11
12
13
14
15
16
17
18
19
20
containers:
      - args:
        - /nginx-ingress-controller
        - --default-backend-service=$(POD_NAMESPACE)/default-http-backend
        - --configmap=$(POD_NAMESPACE)/nginx-configuration
        - --election-id=ingress-controller-leader
        - --ingress-class=nginx
        - --tcp-services-configmap=$(POD_NAMESPACE)/tcp-services
        - --udp-services-configmap=$(POD_NAMESPACE)/udp-services
        - --annotations-prefix=nginx.ingress.kubernetes.io
        - --enable-metrics=true # add

annotations:
        prometheus.io/port: "10254"
        prometheus.io/scrape: "true"

ports:
  - containerPort: 10254
  	name: prometheus
  	protocol: TCP

建立Service

1
2
3
4
5
6
7
8
9
10
11
12
13
14
15
16
17
18
19
20
21
22
23
apiVersion: v1
kind: Service
metadata:
  annotations:
    prometheus.io/port: "10254"
    prometheus.io/scrape: "true"
  labels:
    app: ingress-nginx
    k8s-app: ingress-nginx
  name: ingress-nginx
  namespace: ingress-nginx
spec:
  ports:
  - name: prometheus
    port: 10254
    protocol: TCP
    targetPort: 10254
  selector:
    xxxx:xxx
  type: NodePort
status:
  loadBalancer: {}

检验

1
2
3
4
5
6
7
8
9
10
11
12
13
14
curl http://127.0.0.1:nodeport/metrics

# HELP go_gc_duration_seconds A summary of the pause duration of garbage collection cycles.
# TYPE go_gc_duration_seconds summary
go_gc_duration_seconds{quantile="0"} 1.1714e-05
go_gc_duration_seconds{quantile="0.25"} 2.5922e-05
go_gc_duration_seconds{quantile="0.5"} 4.1336e-05
go_gc_duration_seconds{quantile="0.75"} 6.3554e-05
go_gc_duration_seconds{quantile="1"} 0.007973384
go_gc_duration_seconds_sum 0.137099061
go_gc_duration_seconds_count 1951
# HELP go_goroutines Number of goroutines that currently exist.
# TYPE go_goroutines gauge
go_goroutines 95

建立ServiceMonitor

1
2
3
4
5
6
7
8
9
10
11
12
13
14
15
16
17
18
19
apiVersion: monitoring.coreos.com/v1
kind: ServiceMonitor
metadata:
  labels:
    k8s-apps: ingress-nginx
  name: xxx
  namespace: xxx
spec:
  endpoints:
  - interval: 15s
    port: prometheus
  jobLabel: k8s-app
  namespaceSelector:
    matchNames:
    - ingress-nginx
  selector:
    matchLabels:
      k8s-app: ingress-nginx

能数据收集一段时间

image-20221212100822636

增强exporter

https://github.com/martin-helmich/prometheus-nginxlog-exporter,依赖access.log实现status统计

通过nginx-ingress-controller,sidecar部署

1
2
3
4
5
6
7
8
9
10
11
12
13
14
15
16
17
18
19
20
21
22
23

       volumeMounts:
       ....
        - mountPath: /var/log/nginx
          name: shared-data


- args:
	- mnt/nginxlogs/access.log
  image: nginx/prometheus-nginxlog-exporter:v1.10.0
  imagePullPolicy: IfNotPresent
  name: exporter
  ports:
  - containerPort: 4040
  	name: exporter2
  	protocol: TCP
  volumeMounts:
  - mountPath: /mnt/nginxlogs
  	name: shared-data
  
	volumes:
  - emptyDir: {}
  	name: shared-data

配置configmap:ingress-nginx-controller ns:ingress-nginx 参考

1
log-format-upstream: $remote_addr - $remote_user [$time_local] "$request" $status $body_bytes_sent "$http_referer" "$http_user_agent" "$http_x_forwarded_for"

lua exporter

参考:https://github.com/knyar/nginx-lua-prometheus

主要使用ingress-nginx的自定义nginx.conf模板,因为使用lua exporter需要对nginx.conf进行修改。

修改ingress-nginx-controller

1
2
3
4
5
6
7
8
9
10
11
12
13
14
15
16
17
18
	   ports:
	   - containerPort: 9145
     	 name: lua
       protocol: TCP
          
        volumeMounts:
        - mountPath: /etc/nginx/template
          name: nginx-template
        - mountPath: /etc/nginx/nginx-lua-prometheus
          name: nginx-lua-prometheus
          
      volumes:
      - configMap:
          name: nginx-template # 修改过后的模板
        name: nginx-template   
      - configMap:
          name: nginx-lua-prometheus # lua依赖
        name: nginx-lua-prometheus

获取模板

1
docker cp container-id:/etc/nginx/template/nginx.tmpl .

修改模板 在http部分,可以根据修改内容,但是修改的位置大概就是这些

1
2
3
4
5
6
7
8
9
10
11
12
13
14
15
16
17
18
19
20
21
22
23
24
25
26
27
28
29
30
31
32
33
34
35
36
37
38
39
40
41
42
43
44
45
46
47
48
http {
		lua_shared_dict prometheus_metrics 10M;  # add
    #update
    lua_package_path "/etc/nginx/lua/?.lua;/etc/nginx/nginx-lua-prometheus/?.lua;;"; 
   
    # add
  	log_by_lua_block {
      metric_requests:inc(1, {ngx.var.server_name, ngx.var.status})
      metric_latency:observe(tonumber(ngx.var.request_time), {ngx.var.server_name})
    }
  
  
      init_worker_by_lua_block {
        lua_ingress.init_worker()
        balancer.init_worker()
        
        monitor.init_worker()
        

        plugins.run()
				
        # add
        prometheus = require("prometheus").init("prometheus_metrics")

        metric_requests = prometheus:counter(
          "nginx_http_requests_total", "Number of HTTP requests", {"host", "status"})
        metric_latency = prometheus:histogram(
          "nginx_http_request_duration_seconds", "HTTP request latency", {"host"})
        metric_connections = prometheus:gauge(
          "nginx_http_connections", "Number of HTTP connections", {"state"})
    }
  
  
  ....
    # add
  	server {
	  listen 9145;
	  location /metrics {
		content_by_lua_block {
		  metric_connections:set(ngx.var.connections_reading, {"reading"})
		  metric_connections:set(ngx.var.connections_waiting, {"waiting"})
		  metric_connections:set(ngx.var.connections_writing, {"writing"})
		  prometheus:collect()
		}
	  }
	}
  
}

模板修改完后放入到configmap,同时

image-20221221121955494

lua依赖也放到configmap。

es

https://github.com/prometheus-community/helm-charts/tree/main/charts/prometheus-elasticsearch-exporter

1
2
3
4
5
6
helm repo add prometheus-community https://prometheus-community.github.io/helm-charts
helm repo update
helm fetch prometheus-community/prometheus-elasticsearch-exporter

helm install esexporter prometheus-elasticsearch-exporter-5.0.0.tgz -f values.yaml

1
quay.io/prometheuscommunity/elasticsearch-exporter:v1.5.0

values.yaml

1
2
3
4
5
image:
  repository: prometheuscommunity/elasticsearch-exporter
  
es:
  uri: http://quickstart-es-http:9200

ServiceMonitor

1
2
3
4
5
6
7
8
9
10
11
12
13
14
15
16
apiVersion: monitoring.coreos.com/v1
kind: ServiceMonitor
metadata:
  name: elasticsearch-exporter
  namespace: default
spec:
  endpoints:
  - interval: 15s
    port: http
  namespaceSelector:
    matchNames:
    - default
  selector:
    matchLabels:
      app: prometheus-elasticsearch-exporter

kafka

metrics 例子

官网说明

基于jmxPrometheusExporter

1
2
3
4
5
6
7
8
9
10
11
12
13
14
15
16
17
18
19
20
21
22
23
24
25
26
27
28
29
30
31
32
33
34
35
36
37
38
39
40
41
42
43
44
45
46
47
48
49
50
51
52
53
54
55
56
57
58
59
60
61
62
63
64
65
66
67
68
69
70
71
72
73
74
75
76
77
78
79
80
81
82
83
84
85
86
87
88
89
90
91
92
93
94
95
96
97
98
99
100
101
102
103
104
105
106
107
108
109
110
111
112
113
114
115
116
117
118
119
120
121
122
123
124
125
126
127
128
129
130
131
132
133
134
135
136
137
138
139
140
141
142
143
144
145
146
147
148
149
150
151
152
153
154
155
156
157
158
159
160
161
162
163
164
165
166
167
168
169
170
171
172
173
174
175
176
177
178
179
180
181
182
183
184
185
186
187
188
189
190
191
192
193
194
195
196
197
198
199
200
201
202
203
204
205
206
207
208
209
210
211
212
213
214
215
216
217
218
219
220
221
222
223
224
225
226
227
228
229
230
apiVersion: kafka.strimzi.io/v1beta2
kind: Kafka
metadata:
  name: my-cluster
spec:
  kafka:
    version: 3.3.1
    replicas: 3
    listeners:
      - name: plain
        port: 9092
        type: internal
        tls: false
      - name: tls
        port: 9093
        type: internal
        tls: true
    readinessProbe:
      initialDelaySeconds: 15
      timeoutSeconds: 5
    livenessProbe:
      initialDelaySeconds: 15
      timeoutSeconds: 5
    config:
      offsets.topic.replication.factor: 3
      transaction.state.log.replication.factor: 3
      transaction.state.log.min.isr: 2
      default.replication.factor: 3
      min.insync.replicas: 2
      inter.broker.protocol.version: "3.3"
    storage:
      type: jbod
      volumes:
      - id: 0
        type: persistent-claim
        size: 100Gi
        deleteClaim: false
    metricsConfig:
      type: jmxPrometheusExporter
      valueFrom:
        configMapKeyRef:
          name: kafka-metrics
          key: kafka-metrics-config.yml
  zookeeper:
    replicas: 3
    readinessProbe:
      initialDelaySeconds: 15
      timeoutSeconds: 5
    livenessProbe:
      initialDelaySeconds: 15
      timeoutSeconds: 5
    storage:
      type: persistent-claim
      size: 100Gi
      deleteClaim: false
    metricsConfig:
      type: jmxPrometheusExporter
      valueFrom:
        configMapKeyRef:
          name: kafka-metrics
          key: zookeeper-metrics-config.yml
  entityOperator:
    topicOperator: {}
    userOperator: {}
  kafkaExporter:
    topicRegex: ".*"
    groupRegex: ".*"
---
kind: ConfigMap
apiVersion: v1
metadata:
  name: kafka-metrics
  labels:
    app: strimzi
data:
  kafka-metrics-config.yml: |
    # See https://github.com/prometheus/jmx_exporter for more info about JMX Prometheus Exporter metrics
    lowercaseOutputName: true
    rules:
    # Special cases and very specific rules
    - pattern: kafka.server<type=(.+), name=(.+), clientId=(.+), topic=(.+), partition=(.*)><>Value
      name: kafka_server_$1_$2
      type: GAUGE
      labels:
       clientId: "$3"
       topic: "$4"
       partition: "$5"
    - pattern: kafka.server<type=(.+), name=(.+), clientId=(.+), brokerHost=(.+), brokerPort=(.+)><>Value
      name: kafka_server_$1_$2
      type: GAUGE
      labels:
       clientId: "$3"
       broker: "$4:$5"
    - pattern: kafka.server<type=(.+), cipher=(.+), protocol=(.+), listener=(.+), networkProcessor=(.+)><>connections
      name: kafka_server_$1_connections_tls_info
      type: GAUGE
      labels:
        cipher: "$2"
        protocol: "$3"
        listener: "$4"
        networkProcessor: "$5"
    - pattern: kafka.server<type=(.+), clientSoftwareName=(.+), clientSoftwareVersion=(.+), listener=(.+), networkProcessor=(.+)><>connections
      name: kafka_server_$1_connections_software
      type: GAUGE
      labels:
        clientSoftwareName: "$2"
        clientSoftwareVersion: "$3"
        listener: "$4"
        networkProcessor: "$5"
    - pattern: "kafka.server<type=(.+), listener=(.+), networkProcessor=(.+)><>(.+):"
      name: kafka_server_$1_$4
      type: GAUGE
      labels:
       listener: "$2"
       networkProcessor: "$3"
    - pattern: kafka.server<type=(.+), listener=(.+), networkProcessor=(.+)><>(.+)
      name: kafka_server_$1_$4
      type: GAUGE
      labels:
       listener: "$2"
       networkProcessor: "$3"
    # Some percent metrics use MeanRate attribute
    # Ex) kafka.server<type=(KafkaRequestHandlerPool), name=(RequestHandlerAvgIdlePercent)><>MeanRate
    - pattern: kafka.(\w+)<type=(.+), name=(.+)Percent\w*><>MeanRate
      name: kafka_$1_$2_$3_percent
      type: GAUGE
    # Generic gauges for percents
    - pattern: kafka.(\w+)<type=(.+), name=(.+)Percent\w*><>Value
      name: kafka_$1_$2_$3_percent
      type: GAUGE
    - pattern: kafka.(\w+)<type=(.+), name=(.+)Percent\w*, (.+)=(.+)><>Value
      name: kafka_$1_$2_$3_percent
      type: GAUGE
      labels:
        "$4": "$5"
    # Generic per-second counters with 0-2 key/value pairs
    - pattern: kafka.(\w+)<type=(.+), name=(.+)PerSec\w*, (.+)=(.+), (.+)=(.+)><>Count
      name: kafka_$1_$2_$3_total
      type: COUNTER
      labels:
        "$4": "$5"
        "$6": "$7"
    - pattern: kafka.(\w+)<type=(.+), name=(.+)PerSec\w*, (.+)=(.+)><>Count
      name: kafka_$1_$2_$3_total
      type: COUNTER
      labels:
        "$4": "$5"
    - pattern: kafka.(\w+)<type=(.+), name=(.+)PerSec\w*><>Count
      name: kafka_$1_$2_$3_total
      type: COUNTER
    # Generic gauges with 0-2 key/value pairs
    - pattern: kafka.(\w+)<type=(.+), name=(.+), (.+)=(.+), (.+)=(.+)><>Value
      name: kafka_$1_$2_$3
      type: GAUGE
      labels:
        "$4": "$5"
        "$6": "$7"
    - pattern: kafka.(\w+)<type=(.+), name=(.+), (.+)=(.+)><>Value
      name: kafka_$1_$2_$3
      type: GAUGE
      labels:
        "$4": "$5"
    - pattern: kafka.(\w+)<type=(.+), name=(.+)><>Value
      name: kafka_$1_$2_$3
      type: GAUGE
    # Emulate Prometheus 'Summary' metrics for the exported 'Histogram's.
    # Note that these are missing the '_sum' metric!
    - pattern: kafka.(\w+)<type=(.+), name=(.+), (.+)=(.+), (.+)=(.+)><>Count
      name: kafka_$1_$2_$3_count
      type: COUNTER
      labels:
        "$4": "$5"
        "$6": "$7"
    - pattern: kafka.(\w+)<type=(.+), name=(.+), (.+)=(.*), (.+)=(.+)><>(\d+)thPercentile
      name: kafka_$1_$2_$3
      type: GAUGE
      labels:
        "$4": "$5"
        "$6": "$7"
        quantile: "0.$8"
    - pattern: kafka.(\w+)<type=(.+), name=(.+), (.+)=(.+)><>Count
      name: kafka_$1_$2_$3_count
      type: COUNTER
      labels:
        "$4": "$5"
    - pattern: kafka.(\w+)<type=(.+), name=(.+), (.+)=(.*)><>(\d+)thPercentile
      name: kafka_$1_$2_$3
      type: GAUGE
      labels:
        "$4": "$5"
        quantile: "0.$6"
    - pattern: kafka.(\w+)<type=(.+), name=(.+)><>Count
      name: kafka_$1_$2_$3_count
      type: COUNTER
    - pattern: kafka.(\w+)<type=(.+), name=(.+)><>(\d+)thPercentile
      name: kafka_$1_$2_$3
      type: GAUGE
      labels:
        quantile: "0.$4"
  zookeeper-metrics-config.yml: |
    # See https://github.com/prometheus/jmx_exporter for more info about JMX Prometheus Exporter metrics
    lowercaseOutputName: true
    rules:
    # replicated Zookeeper
    - pattern: "org.apache.ZooKeeperService<name0=ReplicatedServer_id(\d+)><>(\w+)"
      name: "zookeeper_$2"
      type: GAUGE
    - pattern: "org.apache.ZooKeeperService<name0=ReplicatedServer_id(\d+), name1=replica.(\d+)><>(\w+)"
      name: "zookeeper_$3"
      type: GAUGE
      labels:
        replicaId: "$2"
    - pattern: "org.apache.ZooKeeperService<name0=ReplicatedServer_id(\d+), name1=replica.(\d+), name2=(\w+)><>(Packets\w+)"
      name: "zookeeper_$4"
      type: COUNTER
      labels:
        replicaId: "$2"
        memberType: "$3"
    - pattern: "org.apache.ZooKeeperService<name0=ReplicatedServer_id(\d+), name1=replica.(\d+), name2=(\w+)><>(\w+)"
      name: "zookeeper_$4"
      type: GAUGE
      labels:
        replicaId: "$2"
        memberType: "$3"
    - pattern: "org.apache.ZooKeeperService<name0=ReplicatedServer_id(\d+), name1=replica.(\d+), name2=(\w+), name3=(\w+)><>(\w+)"
      name: "zookeeper_$4_$5"
      type: GAUGE
      labels:
        replicaId: "$2"
        memberType: "$3"

PodMonitor

1
2
3
4
5
6
7
8
9
10
11
apiVersion: monitoring.coreos.com/v1
kind: PodMonitor
metadata:
  name: kafka-exporter
  namespace: kafka
spec:
  selector:
    matchLabels:
       strimzi.io/cluster: my-cluster
  podMetricsEndpoints:
  - port: tcp-prometheus

longhorn

1
unable to salvage volume pvc-a32e8f07-4366-46be-936e-92e80e238ccd: Disk with UUID 3b8184b4-567f-4789-b3ab-afcea94bd240 on node d-ecs-38357230 is unschedulable for replica pvc-a32e8f07-4366-46be-936e-92e80e238ccd-r-c8592374

查看Node节点的diskUUID

1
2
3
4
5
6


kubectl get nodes.longhorn.io -A
NAMESPACE         NAME             READY   ALLOWSCHEDULING   SCHEDULABLE   AGE
longhorn-system   d-ecs-38357230   True    true              True          20d
1
2
3
4
5
6
7
8
9
10
11
12
13
14
15
16
17
18
19
20
21
22
23
24
  diskStatus:
    default-disk-8fa781d7e1ea551b:
      conditions:
        Ready:
          lastProbeTime: ""
          lastTransitionTime: "2023-01-09T09:46:53Z"
          message: xxxx
          reason: ""
          status: "True"
          type: Ready
        Schedulable:
          lastProbeTime: ""
          lastTransitionTime: "2023-01-19T13:46:32Z"
          message: the disk default-disk-8fa781d7e1ea551b(/var/lib/longhorn/) on the
            node d-ecs-38357230 has 23907532800 available, but requires reserved 30202836172,
            minimal 25% to schedule more replicas
          reason: DiskPressure
          status: "False"
          type: Schedulable
      diskUUID: 3b8184b4-567f-4789-b3ab-afcea94bd240
      scheduledReplica:
      storageAvailable: 23907532800
      storageMaximum: 100676120576
      storageScheduled: 83751862272

检查 the replica scheduling will fail

1
storageAvailable < storageMaximum * 25%