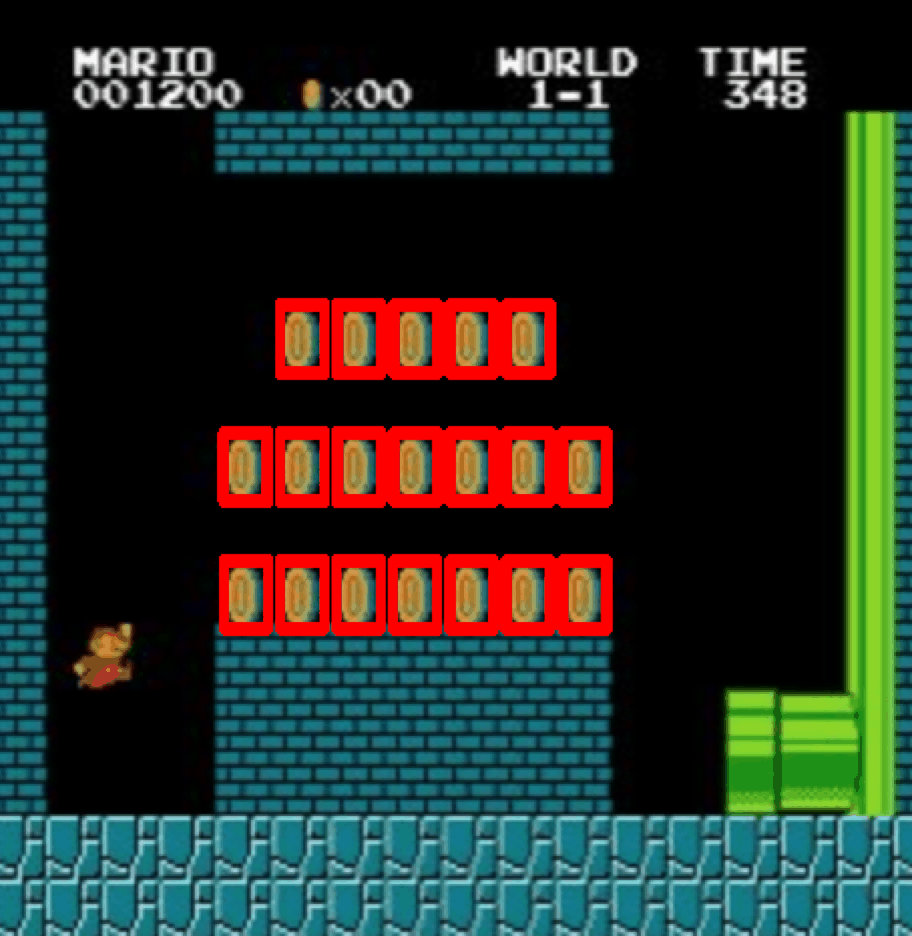
draw
1 | |
鼠标 draw
监听鼠标事件 cv.EVENT_* cv.setMouseCallback('image', draw_circle)
1 | |
UI
1 | |
plot
直方图 histogram
直方图可以对图像灰度分布有一个整体了解,x轴上是灰度值(0到255),y轴是图片中该灰度值的像素点的数目。
1 | |
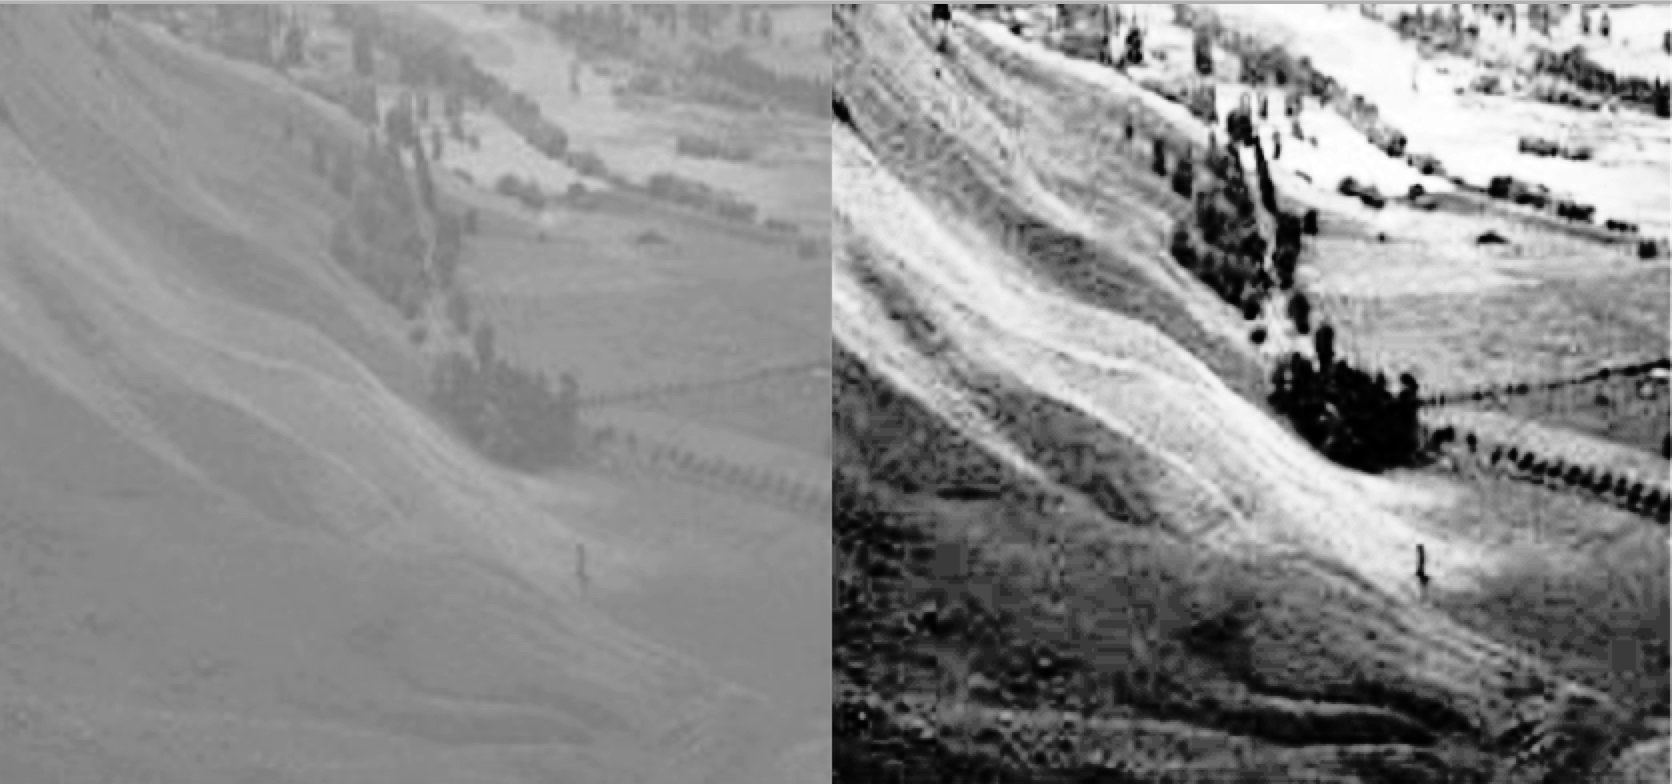
直方图均衡
增加图像整体的对比度,局部对比度较低的区域获得较高的对比度,缺点它可能会增加背景噪音的对比度 ,同时减少可用信号。
1 | |
1 | |
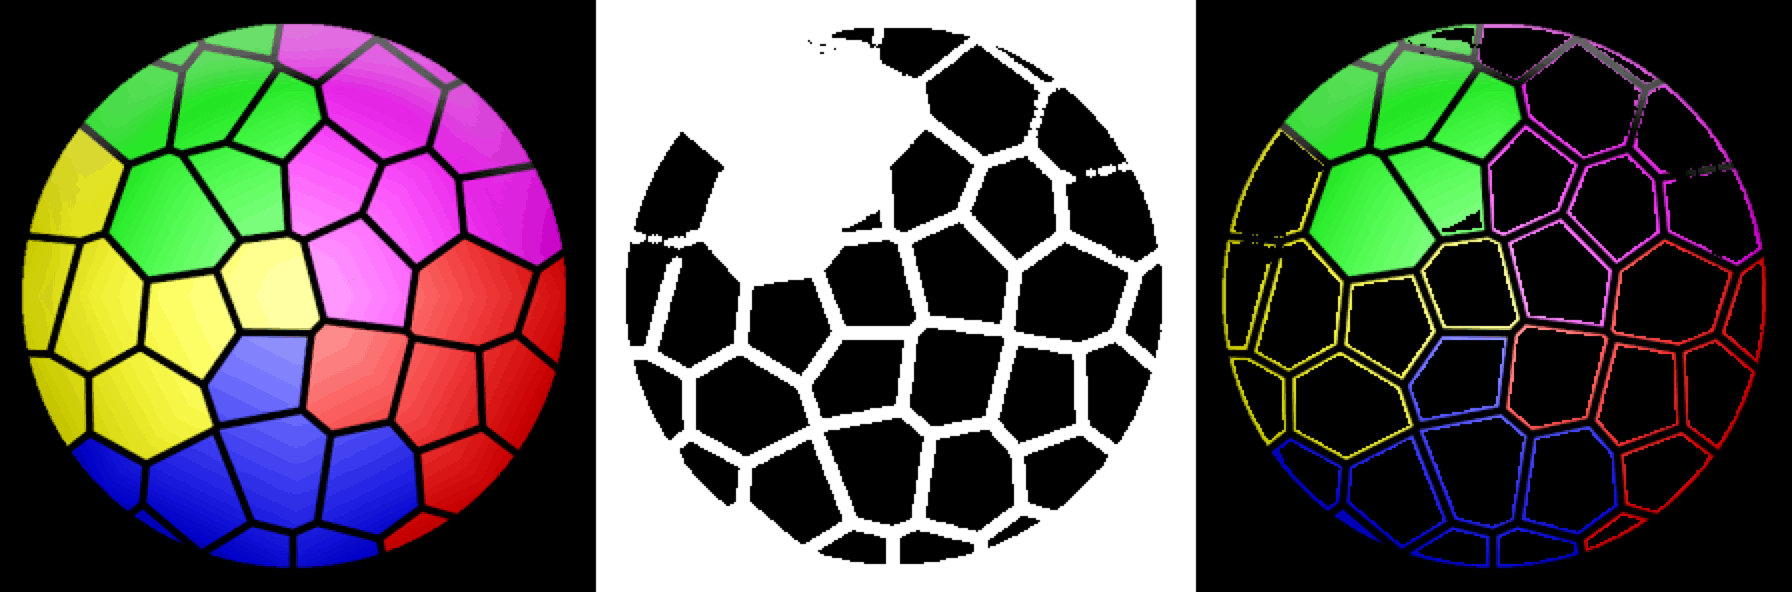
直方图反向投影
用于图像分割或查找图像中感兴趣的对象,创建的图像与我们的输入图像具有相同大小(但是单个通道)的图像,输出的图像我们感兴趣的部分像素值较高(更白)
最好使用颜色直方图,物体的颜色信息比灰度图像更容易被分割和识别。再将颜色直方图投影到tar查找目标,找到输入图像中每一个像素点的像素值在直方图中对应的概率
得到一个概率图像,最后设置适当的阈值对概率图像进行二值化
1 | |
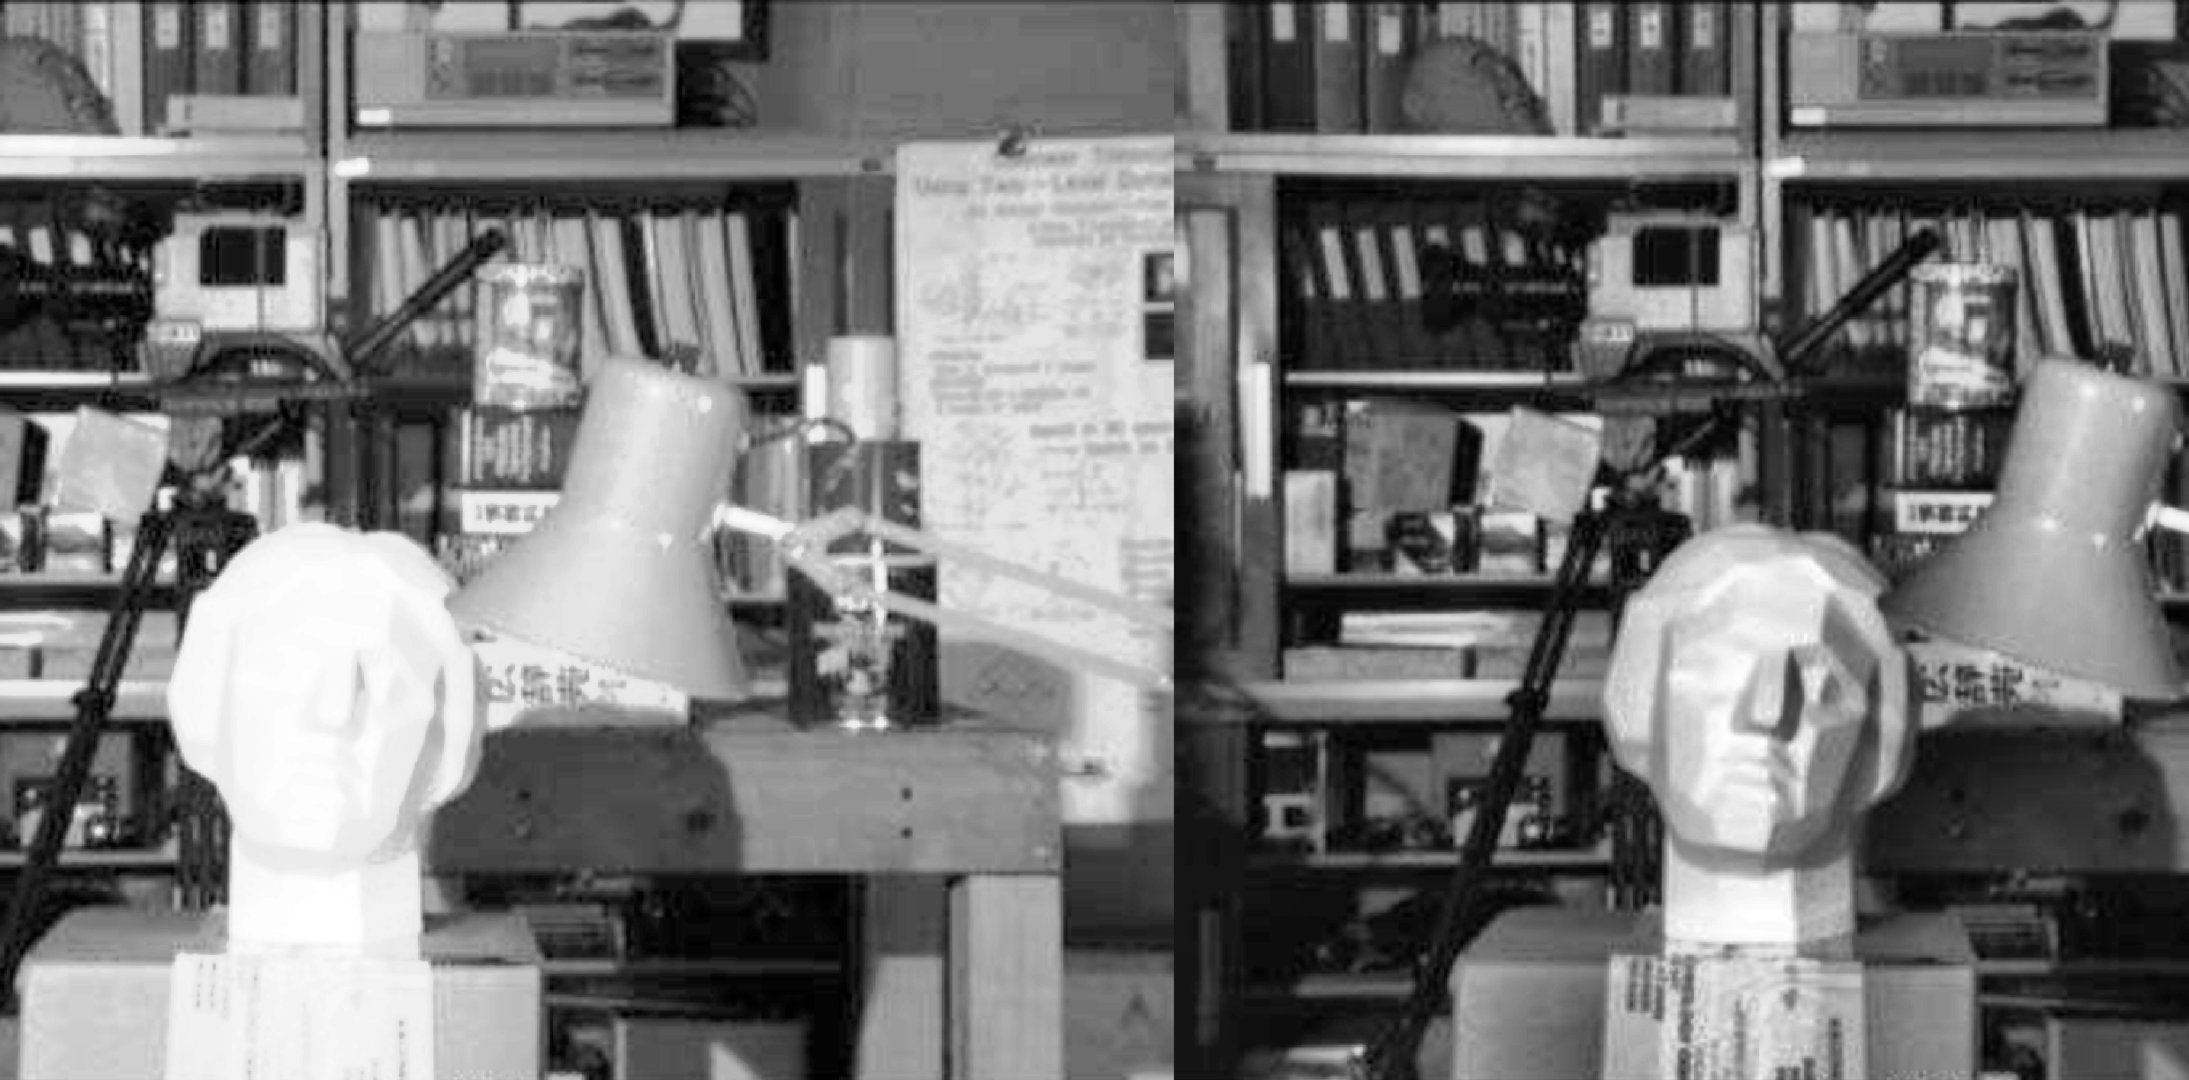
模板匹配
较大图像中搜索和查找模板图像位置的方法
与2D卷积一样 模板图像在输入图像上滑动(类似窗口),在每一个位置对模板图像和输入图像的窗口区域进行匹配。 与直方图的反向投影类似。
输入图像大小是W×H,模板大小是w×h,输出结果的大小(W-w+1,H-h+1)。得到此结果后可以使用函数cv2.minMaxLoc()来找到其中的最小值和最大值的位置。
第一个值为矩形左上角的位置,(w,h)是模板矩形的宽度和高度。矩形就是模板区域。
匹配一个
1 | |
匹配多个
1 | |