自定义Exporter
主要是要实现Collector的接口Describe 和Collect
1 | |
Describe Exceple 告诉 prometheus 我们定义了哪些 prometheus.Desc 结构,通过 channel 传递给上层
1 | |
Collect Example 真正实现数据采集的功能,将采集数据结果通过 channel 传递给上层
1 | |
main example
1 | |
vec/summary/history 用法
-
metric_types只看这个根本看不懂说的啥
CounterVec是一组counter,这些计数器具有相同的描述,但它们的变量标签具有不同的值。 如果要计算按各种维度划分的相同内容
1 | |
要一次性统计四个cpu的温度,这个时候就适合使用GaugeVec了
1 | |
summary
1 | |
Histogram
1 | |
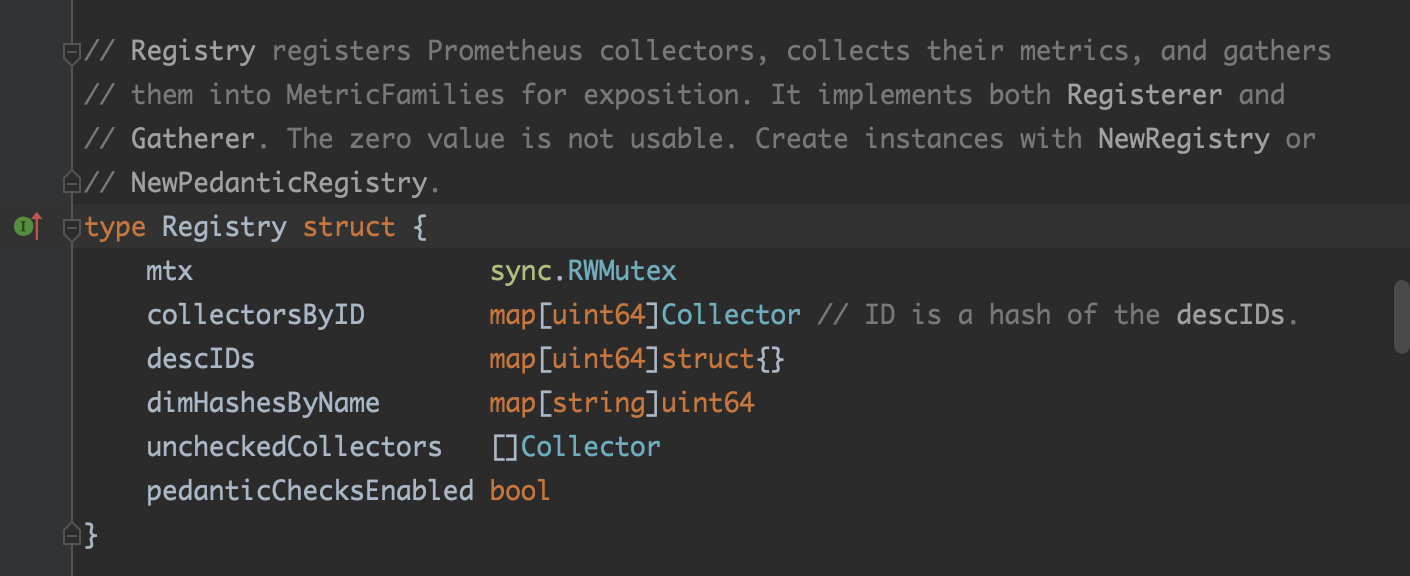
采集源码分析
主要是NewRegistry返回Registry,分别实现了Registerer和Gatherer的接口
调用注册时候调用Collector.Describe
1 | |
Prometheus Server pull 时候会调用/MetricsPath的handler
1 | |
里面会调用Registry.Gather实现,pull的时候才执行collector.Collect
1 | |
然后通过processMetric里面metric.Write输出指标值之类
1 | |
编译成docker image
1 | |
1 | |
golang静态编译
golang 的编译(不涉及 cgo 编译的前提下)默认使用了静态编译,不依赖任何动态链接库。
这样可以任意部署到各种运行环境,不用担心依赖库的版本问题。只是体积大一点而已,存储时占用了一点磁盘,运行时,多占用了一点内存。
静态编译与动态编译的区别 动态编译的 可执行文件 需要附带一个的 动态链接库 ,在执行时,需要调用其对应动态链接库中的命令。所以其优点一方面是缩小了执行文件本身的体积,另一方面是加快了编译速度,节省了 系统资源 。缺点一是哪怕是很简单的程序,只用到了链接库中的一两条命令,也需要附带一个相对庞大的链接库;二是如果其他计算机上没有安装对应的 运行库 ,则用动态编译的可执行文件就不能运行。 静态编译就是编译器在编译可执行文件的时候,将可执行文件需要调用的对应动态链接库(.so)中的部分提取出来,链接到可执行文件中去,使可执行文件在运行的时候不依赖于动态链接库。所以其优缺点与动态编译的可执行文件正好互补。
docker镜像精简
-
scratch:空镜像,基础镜像
scratch是Docker中预留的最小的基础镜像。bosybox 、 Go语言编译打包的镜像都可以基于scratch来构建。
-
busybox
busybox镜像只有几兆。
BusyBox是一个集成了一百多个最常用Linux命令和工具(如cat、echo、grep、mount、telnet等)的精简工具箱,它只有几MB的大小,很方便进行各种快速验证,被誉为“Linux系统的瑞士军刀”。BusyBox可运行于多款POSIX环境的操作系统中,如Linux(包括Android)、Hurd、FreeBSD等。
-
Alpine
Alpine镜像比busybox大一点,也只有几兆。
Alpine操作系统是一个面向安全的轻型Linux发行版。它不同于通常的Linux发行版,Alpine采用了musl libc和BusyBox以减小系统的体积和运行时资源消耗,但功能上比BusyBox又完善得多。在保持瘦身的同时,Alpine还提供了自己的包管理工具apk,可以通过https://pkgs.alpinelinux.org/packages查询包信息,也可以通过apk命令直接查询和安装各种软件。
Alpine Docker镜像也继承了Alpine Linux发行版的这些优势。相比于其他Docker镜像,它的容量非常小,仅仅只有5MB左右(Ubuntu系列镜像接近200MB),且拥有非常友好的包管理机制。官方镜像来自docker-alpine项目。
目前Docker官方已开始推荐使用Alpine替代之前的Ubuntu作为基础镜像环境。这样会带来多个好处,包括镜像下载速度加快,镜像安全性提高,主机之间的切换更方便,占用更少磁盘空间等。
部署
可以看到exporter其实就是个http server,可以使用k8s的Deployment部署,通过arg或者env传参启动exporter
1 | |
一个Service可以公开一个或多个服务端口,通常情况下,这些端口由指向一个Pod的多个Endpoints支持。这也反映在各自的Endpoints对象中。
Prometheus Operator引入ServiceMonitor对象, 它发现Endpoints对象并配置Prometheus去监控这些Pods。通过标签匹配到对应的Service,调用对应对应的服务
ServiceMonitorSpec的endpoints部分用于配置需要收集metrics的Endpoints的端口和其他参数。在一些用例中会直接监控不 在服务endpoints中的pods的端口。因此,在endpoints部分指定endpoint时,请严格使用,不要混淆。
ServiceMonitor和发现的目标可能来自任何namespace。这对于跨namespace的监控十分重要,比如meta-monitoring。使用 PrometheusSpec下ServiceMonitor Namespace Selectorn,通过各自Prometheus server限制ServiceMonitors作用namespece。使用ServiceMonitorSpec下的namespaceSelector可以现在允许发现Endpoints对象的命名空间。要发现所有命 名空间下的目标,namespaceSelector必须为空。
1 | |
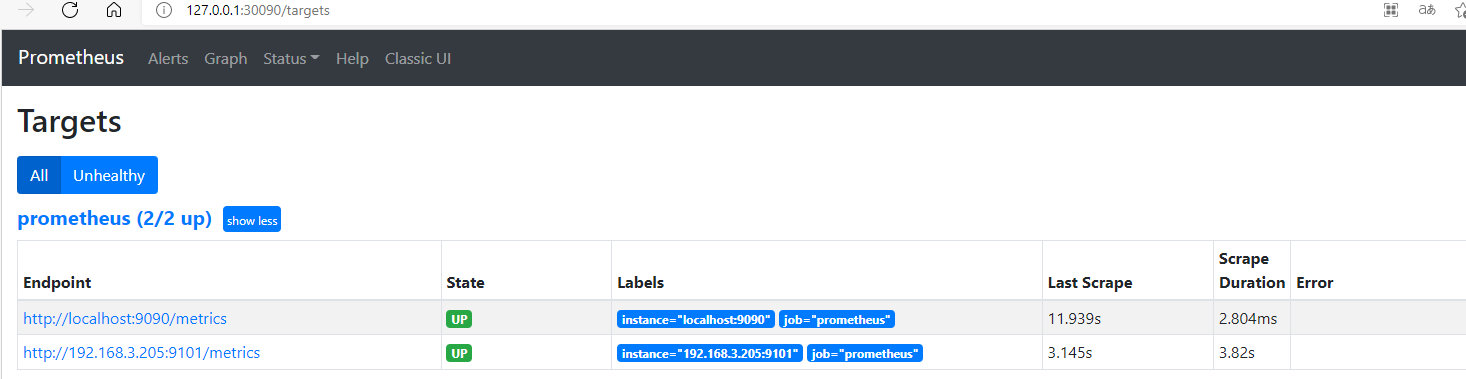
可以看到新发现的target
添加到Grafana
https://blog.csdn.net/hjxzb/article/details/81044583
实例代码
https://github.com/631068264/demo_exporter