二元分类
数据不均衡有效
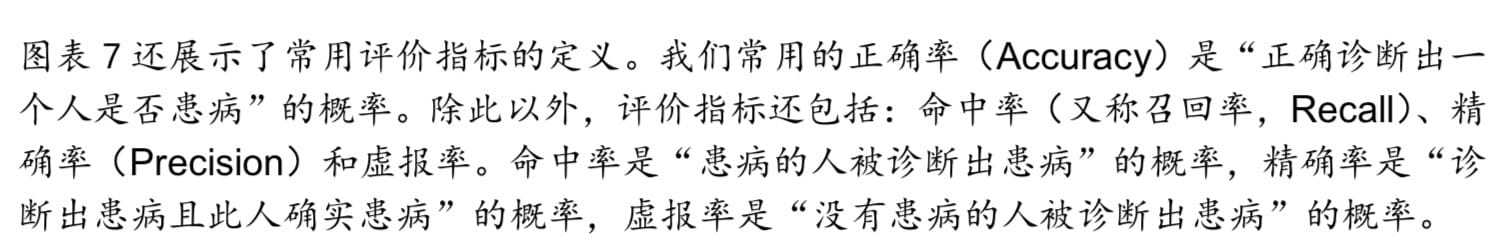
Confusion Matrix 混淆矩阵

1 | |
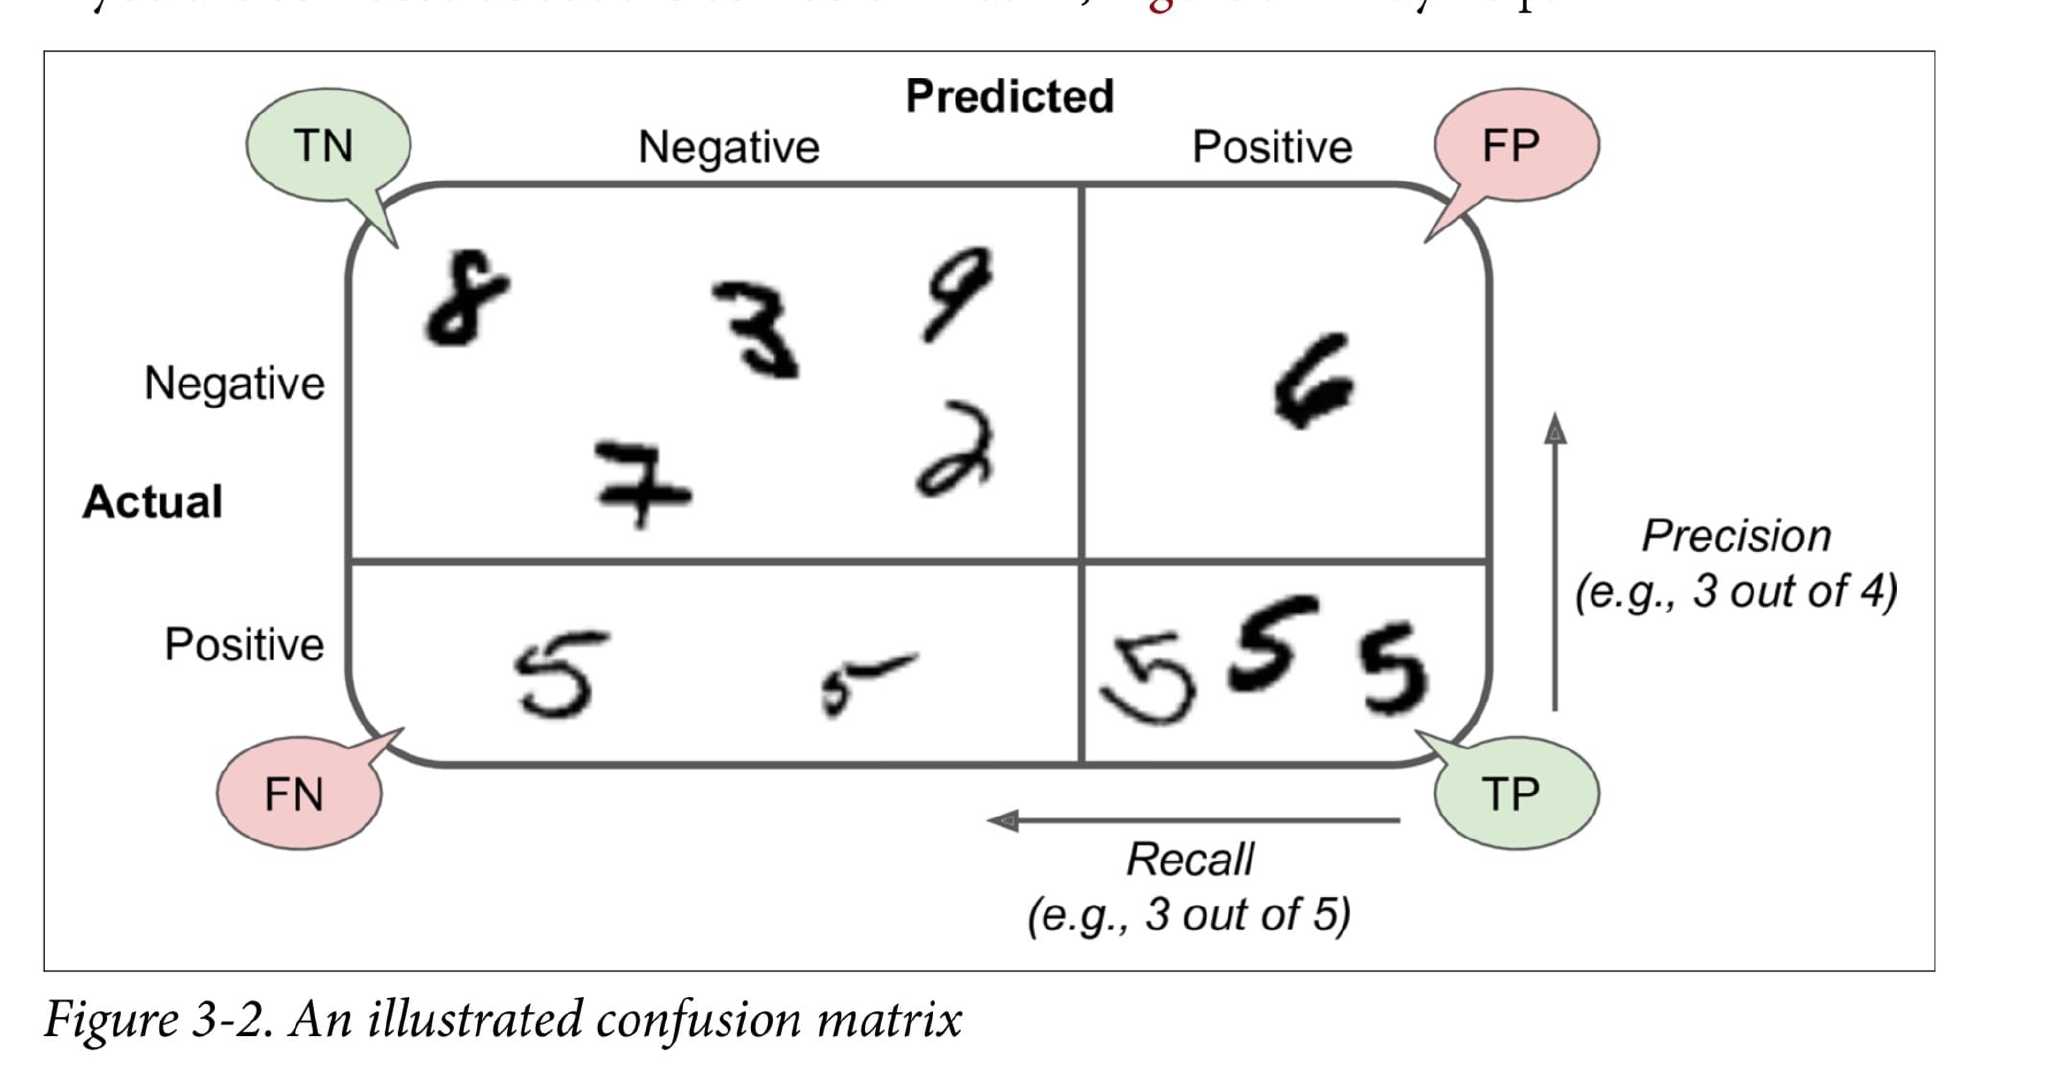
Precision
the accuracy of the positive predictions
\[{precision\;=\;\frac{TP}{TP\;+\;FP}}\]Recall
truepositive rate the ratio of positive instances that are correctly detected by the classifier
\[recall\;=\;\frac{TP}{TP\;+\;FN}\]1 | |
不同情况关注点不一样 防小孩看到黄暴视频,分类器拒绝很多好的视频(low recall),只保留最安全的(high precision)
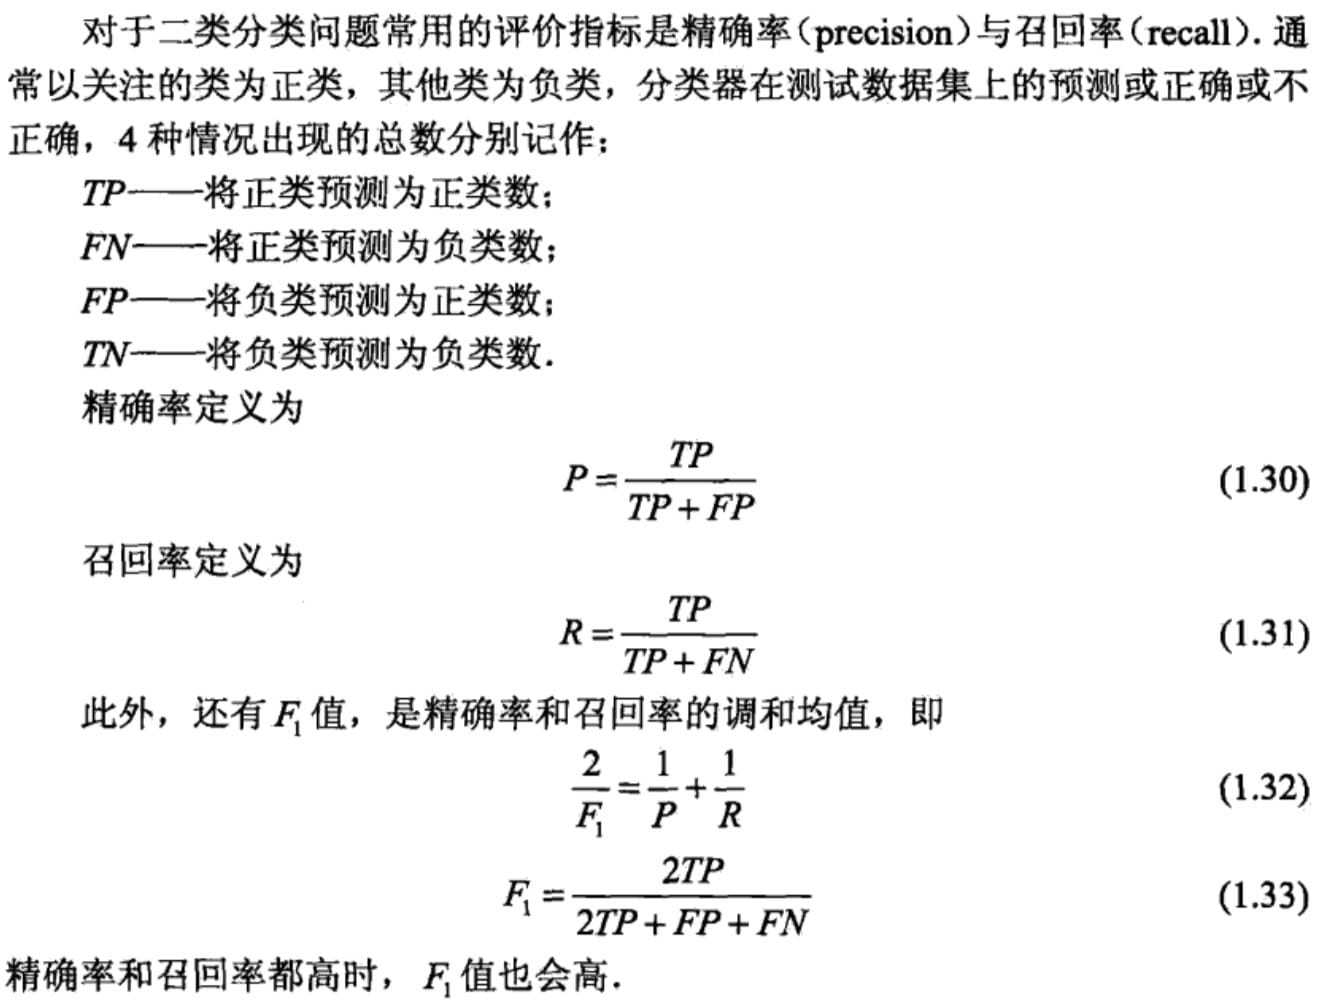
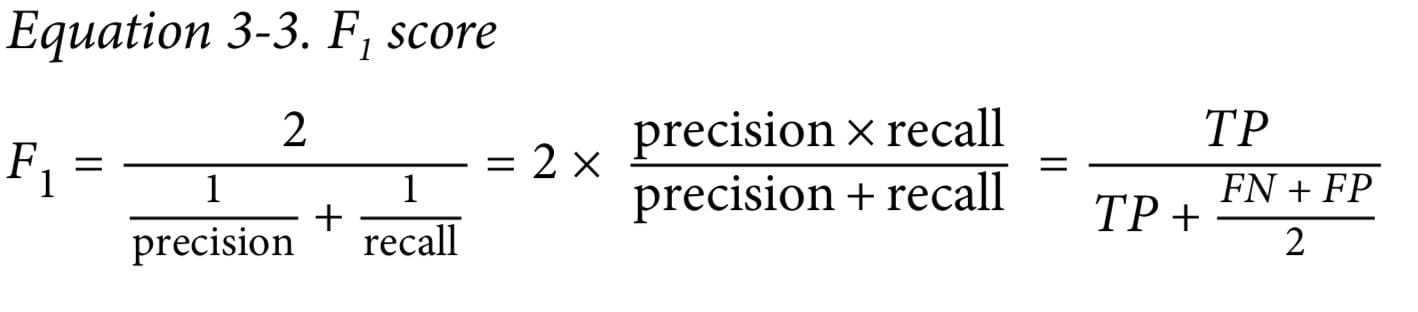
F score
1 | |
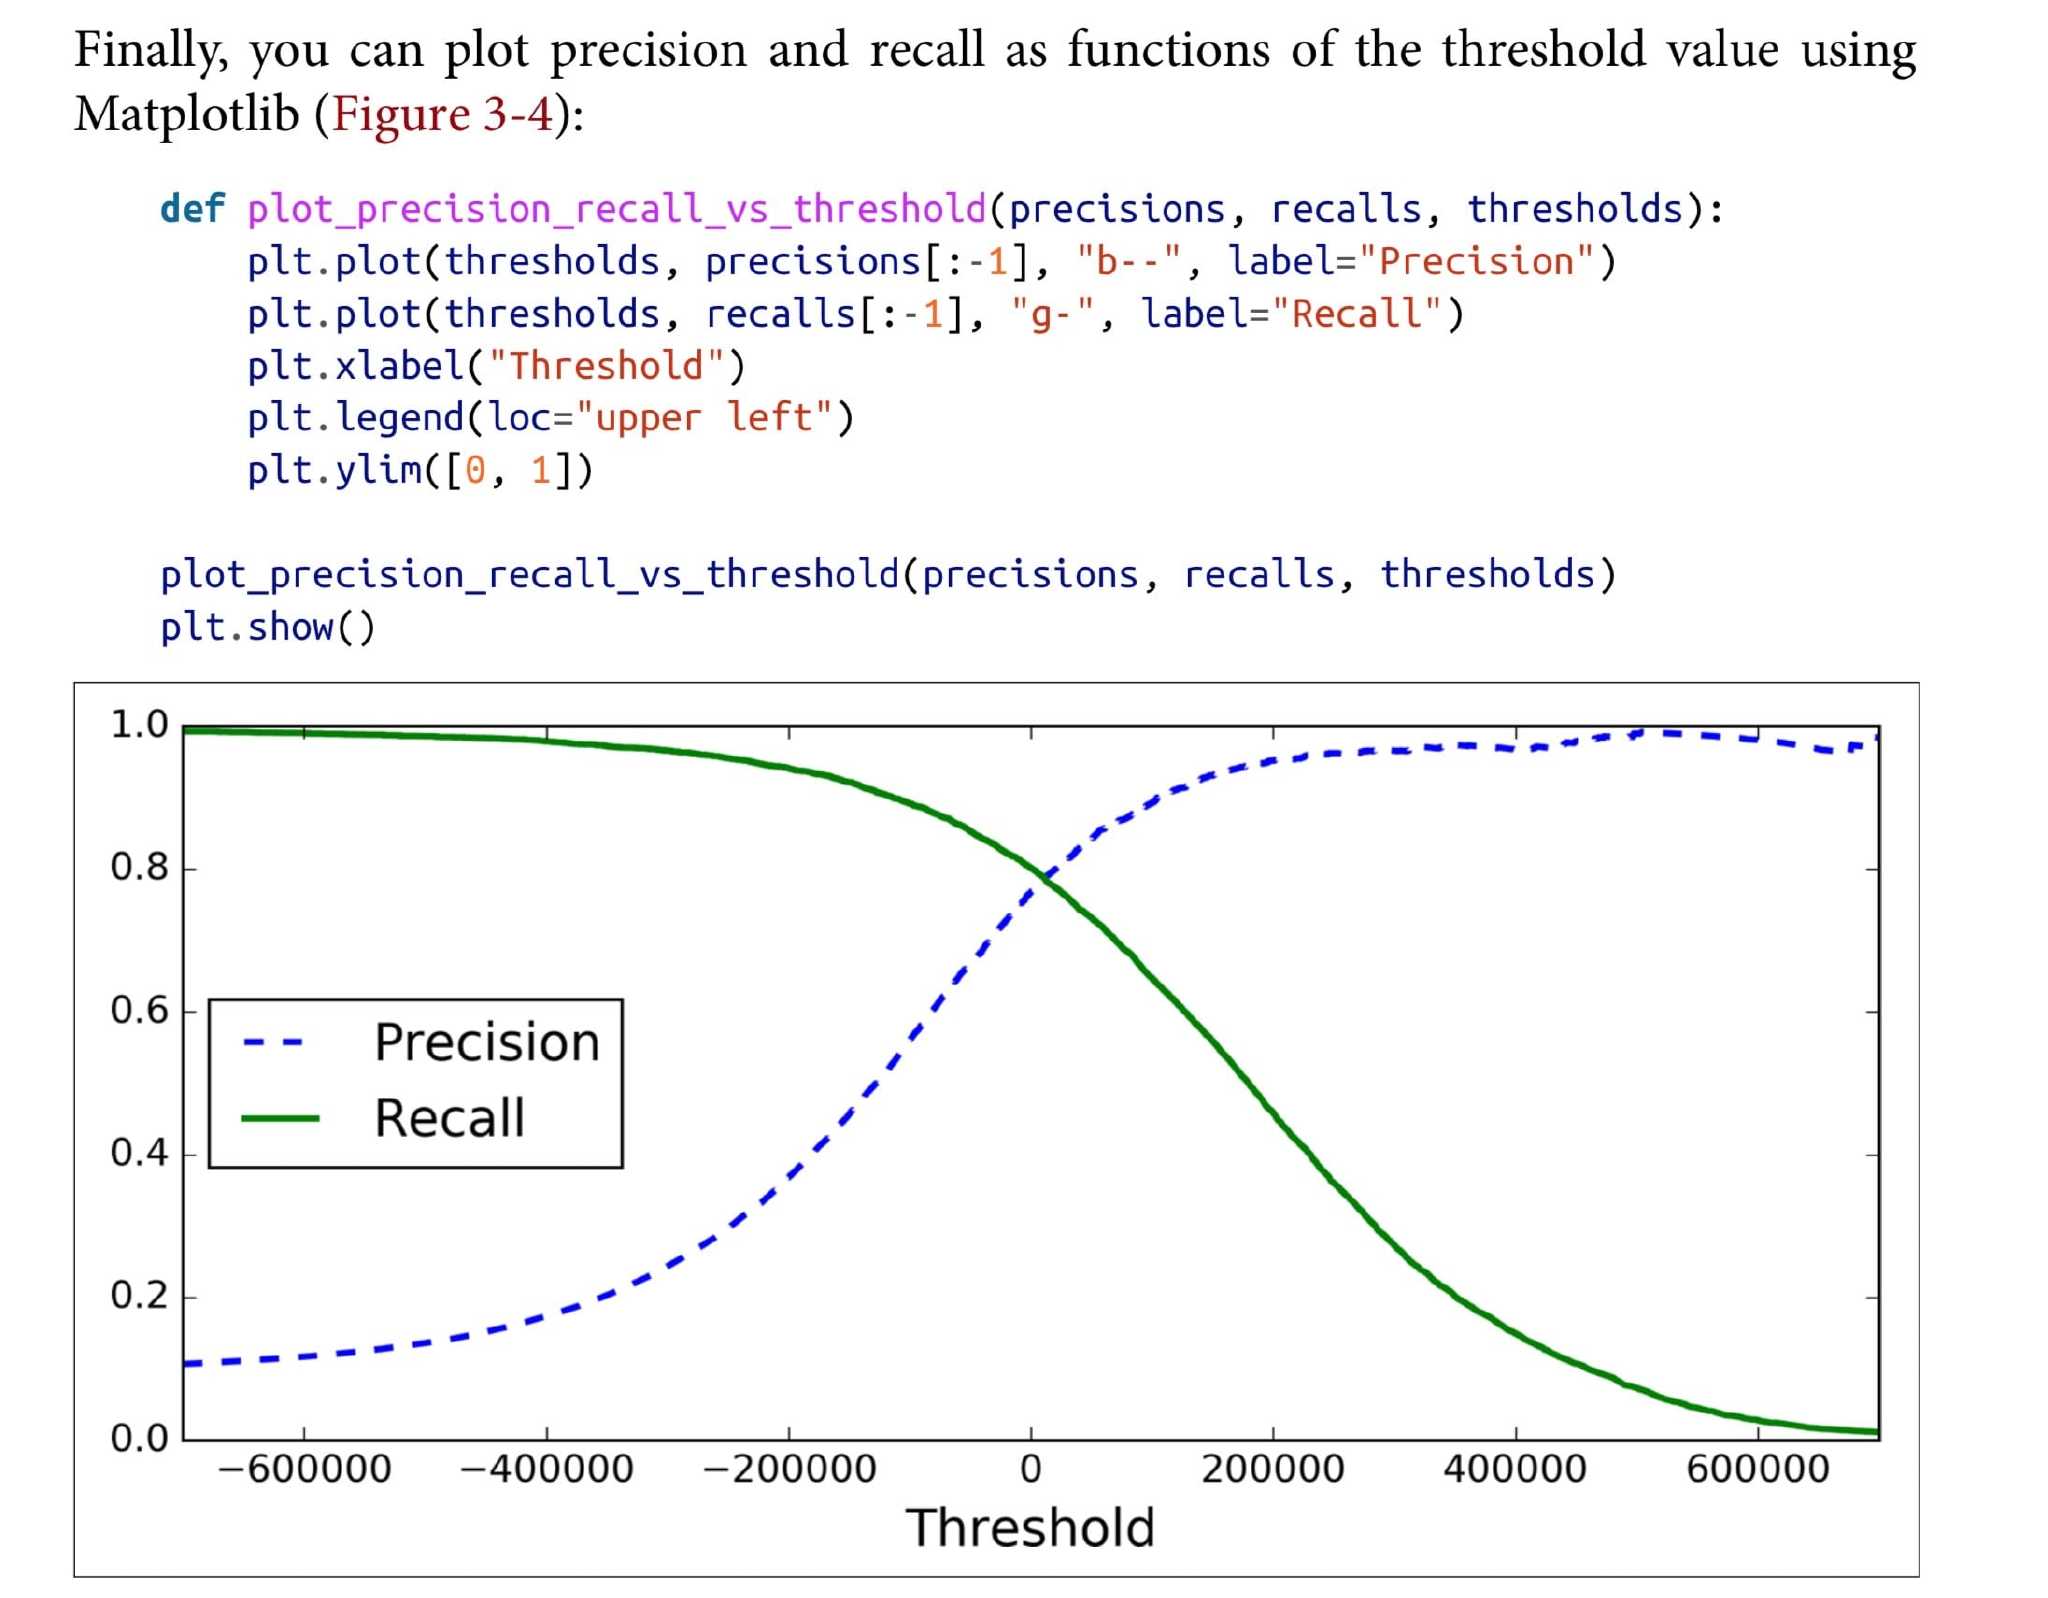
threshold
find threshold for recall and precision
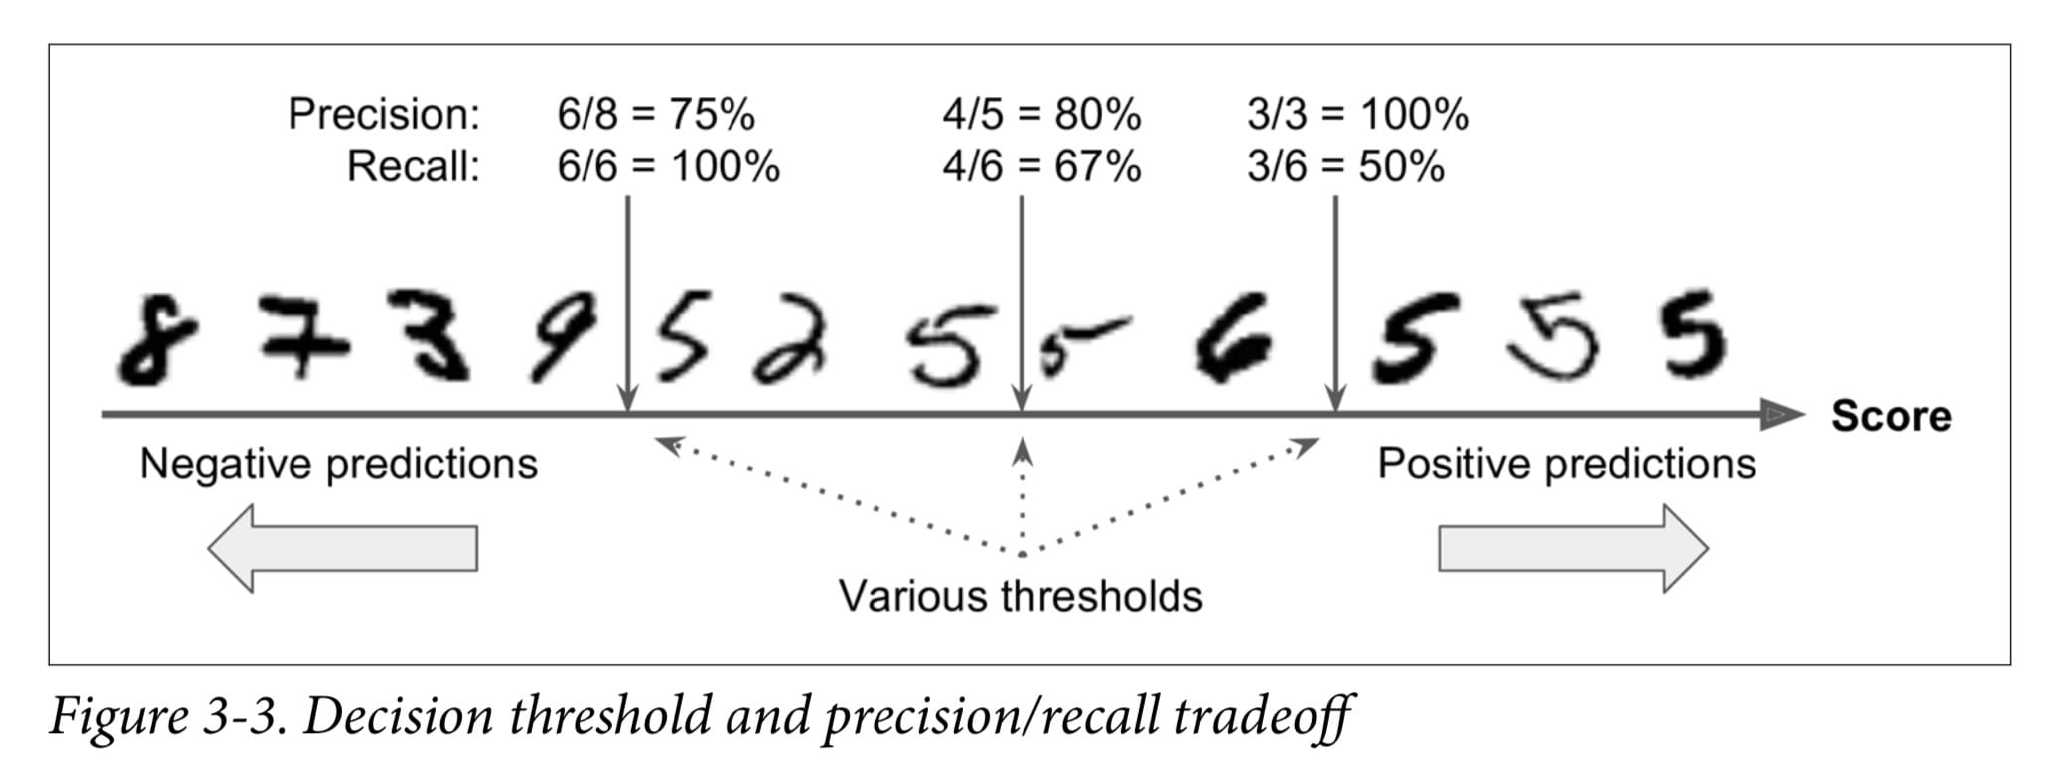
lowering the threshold increases recall and reduces precision
1 | |
1 | |
ROC Curve
The receiver operating characteristic (ROC) curve is another common tool used with binary classifiers
ROC similar to the precision/recall curve AUC area under the ROC curve
1 | |
1 | |
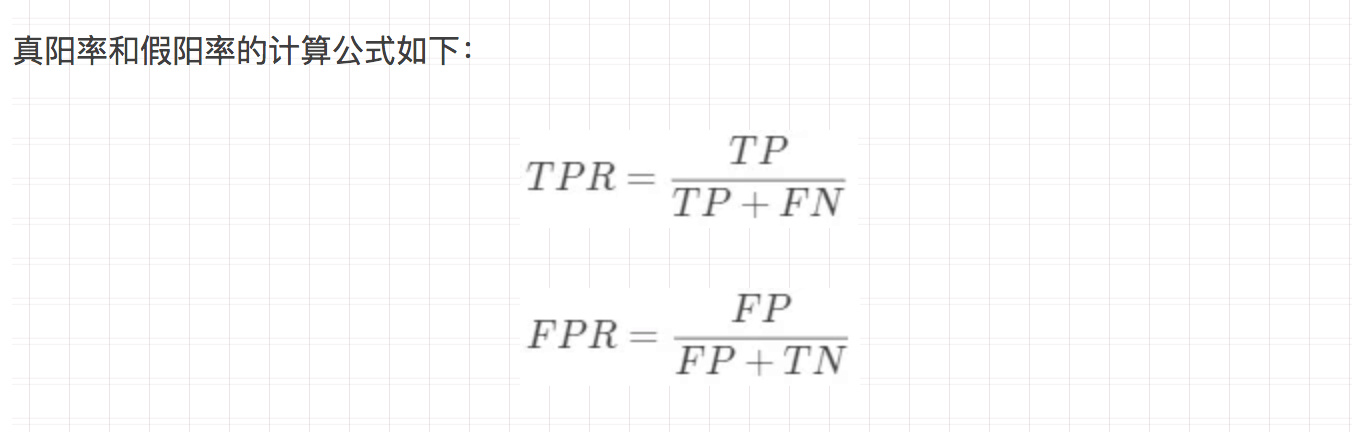
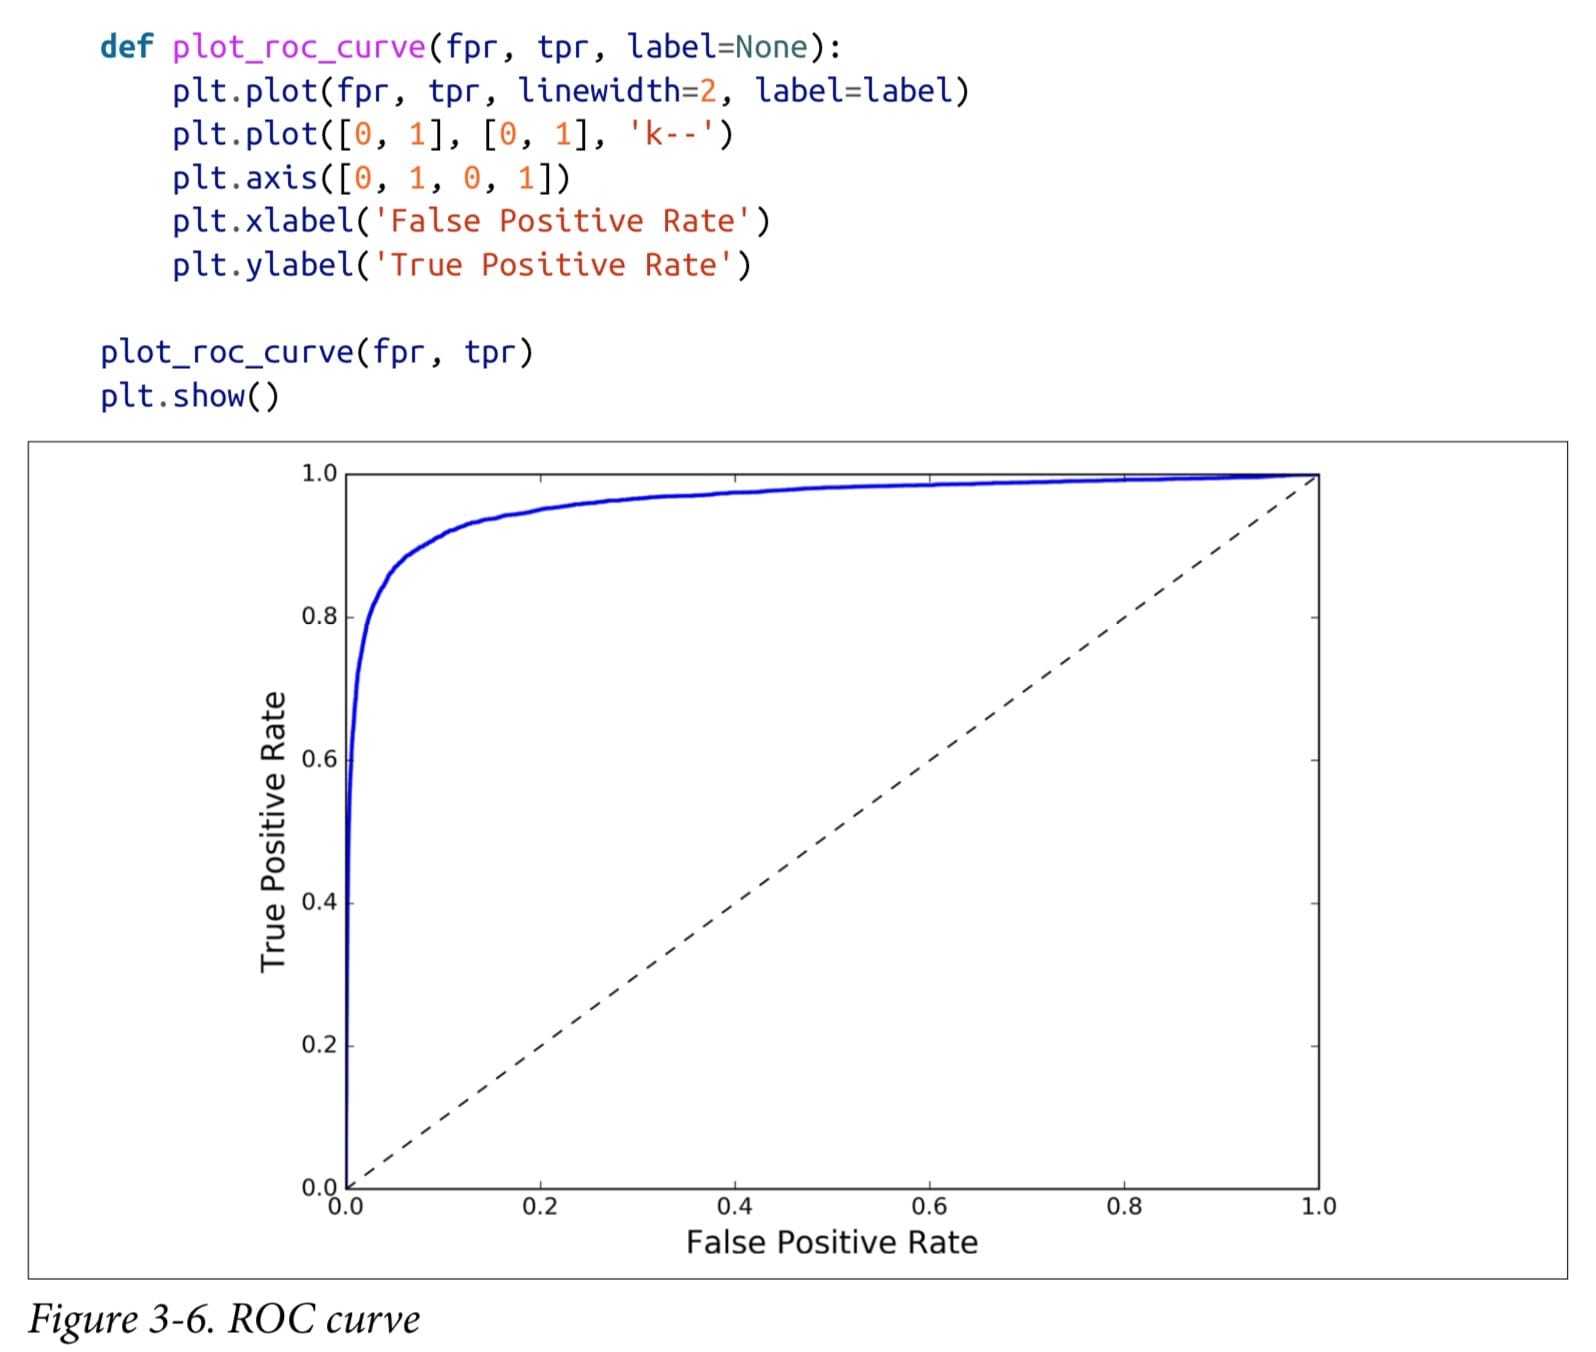 ROC曲线的纵轴是真阳率(TPR),横轴是假阳率(FPR)。
对所有样本的预测值(属于正类的概率值)降序排列,然后依次将预测的概率值作为阈值,每次得到该阈值下模型预测结果为正类、 负类的样本数,然后生成一组 (FPR, TPR) 值,这样就可以得到ROC曲线上的一点,最后将所有的点连接起来就出现了ROC曲线。ROC曲线越靠近左上角,表示效果越好。
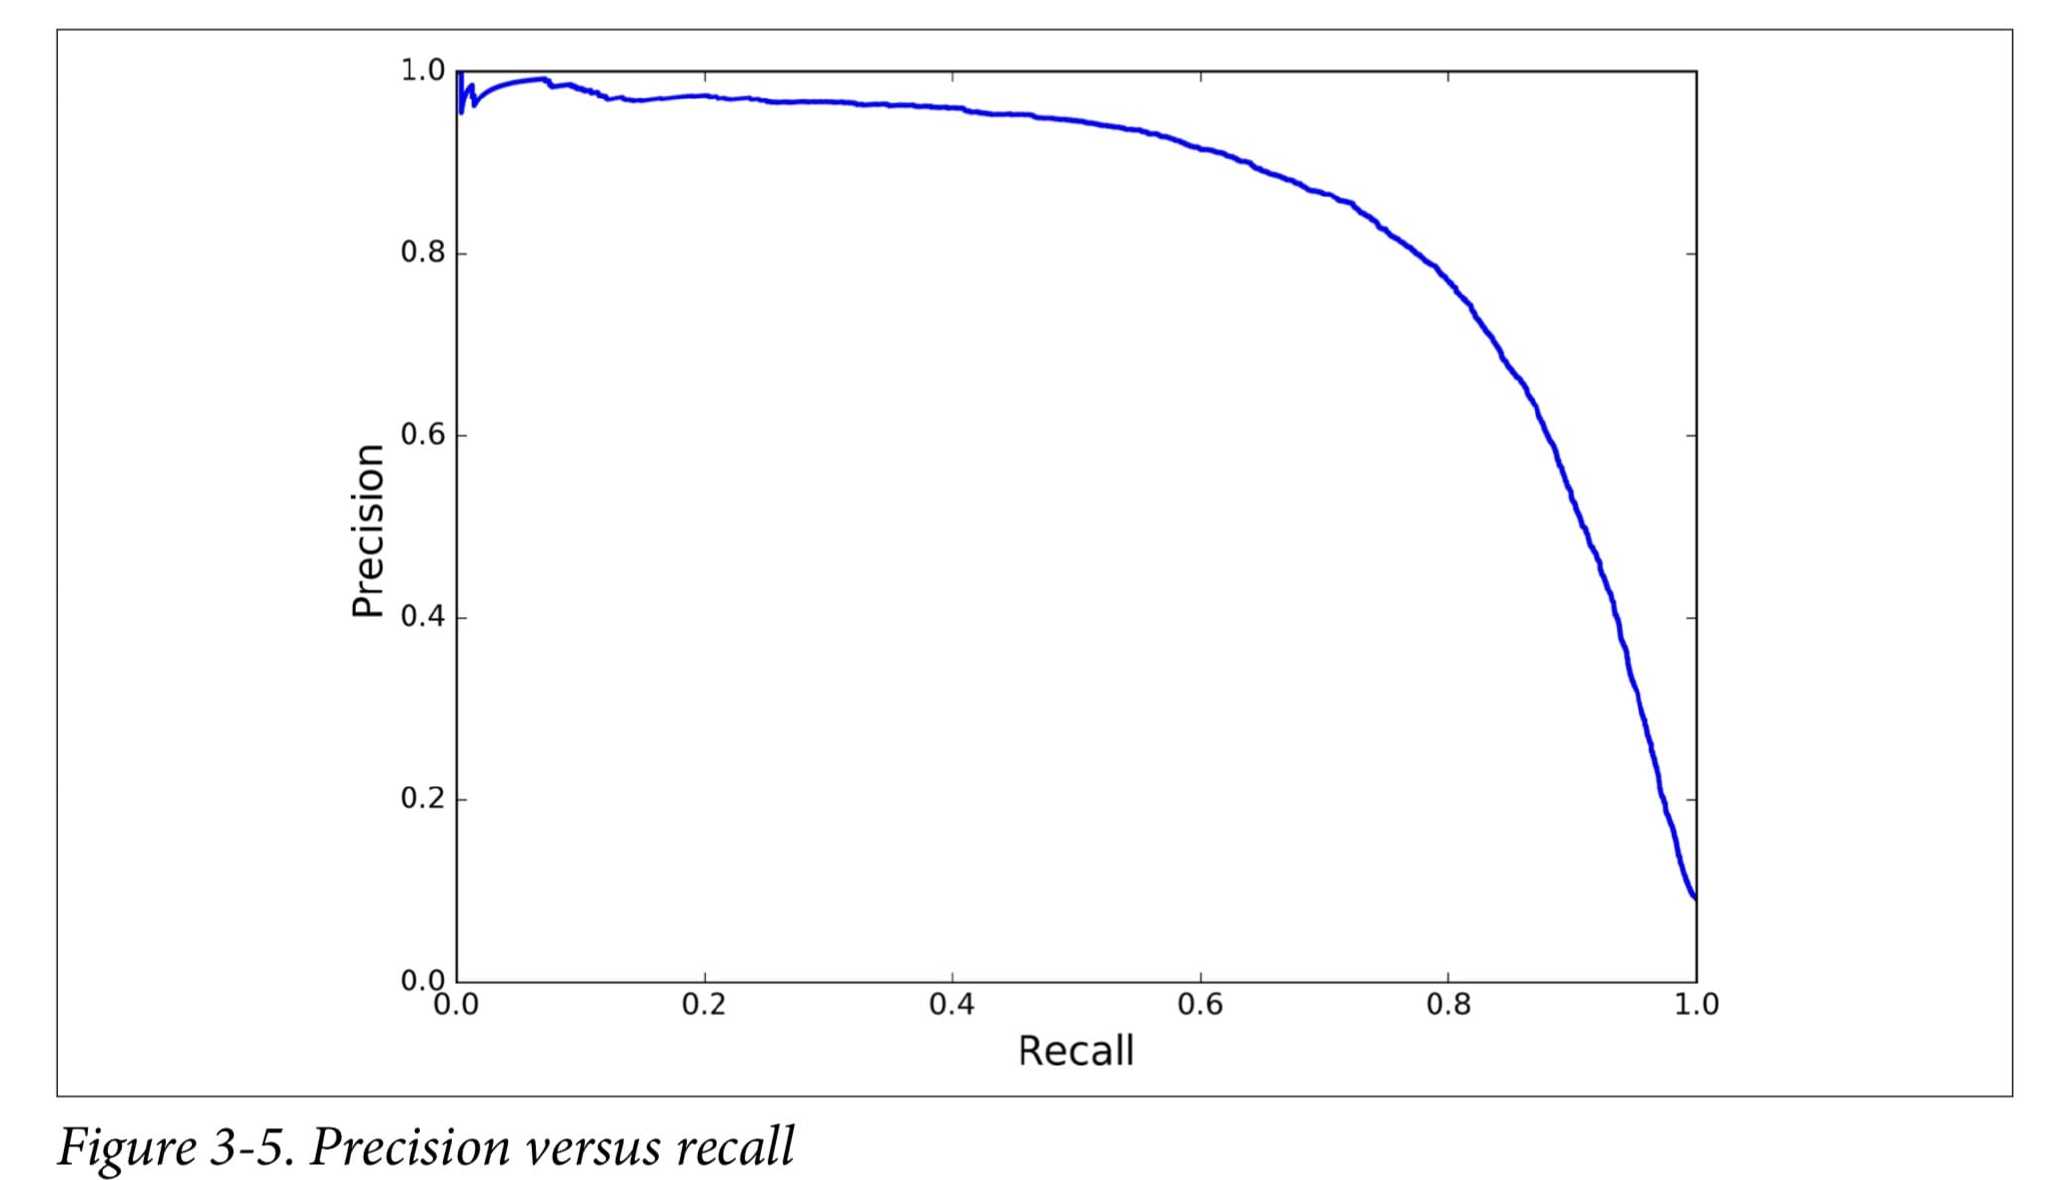
PR curve or ROC curve
PR : positive class is rare or care more about the FP than the FN,其他情况选roc
多元分类
multiple classes : Random Forest classifiers and naive Bayes classifiers
strictly binary classifiers :Support Vector Machine classifiers or Linear classifiers
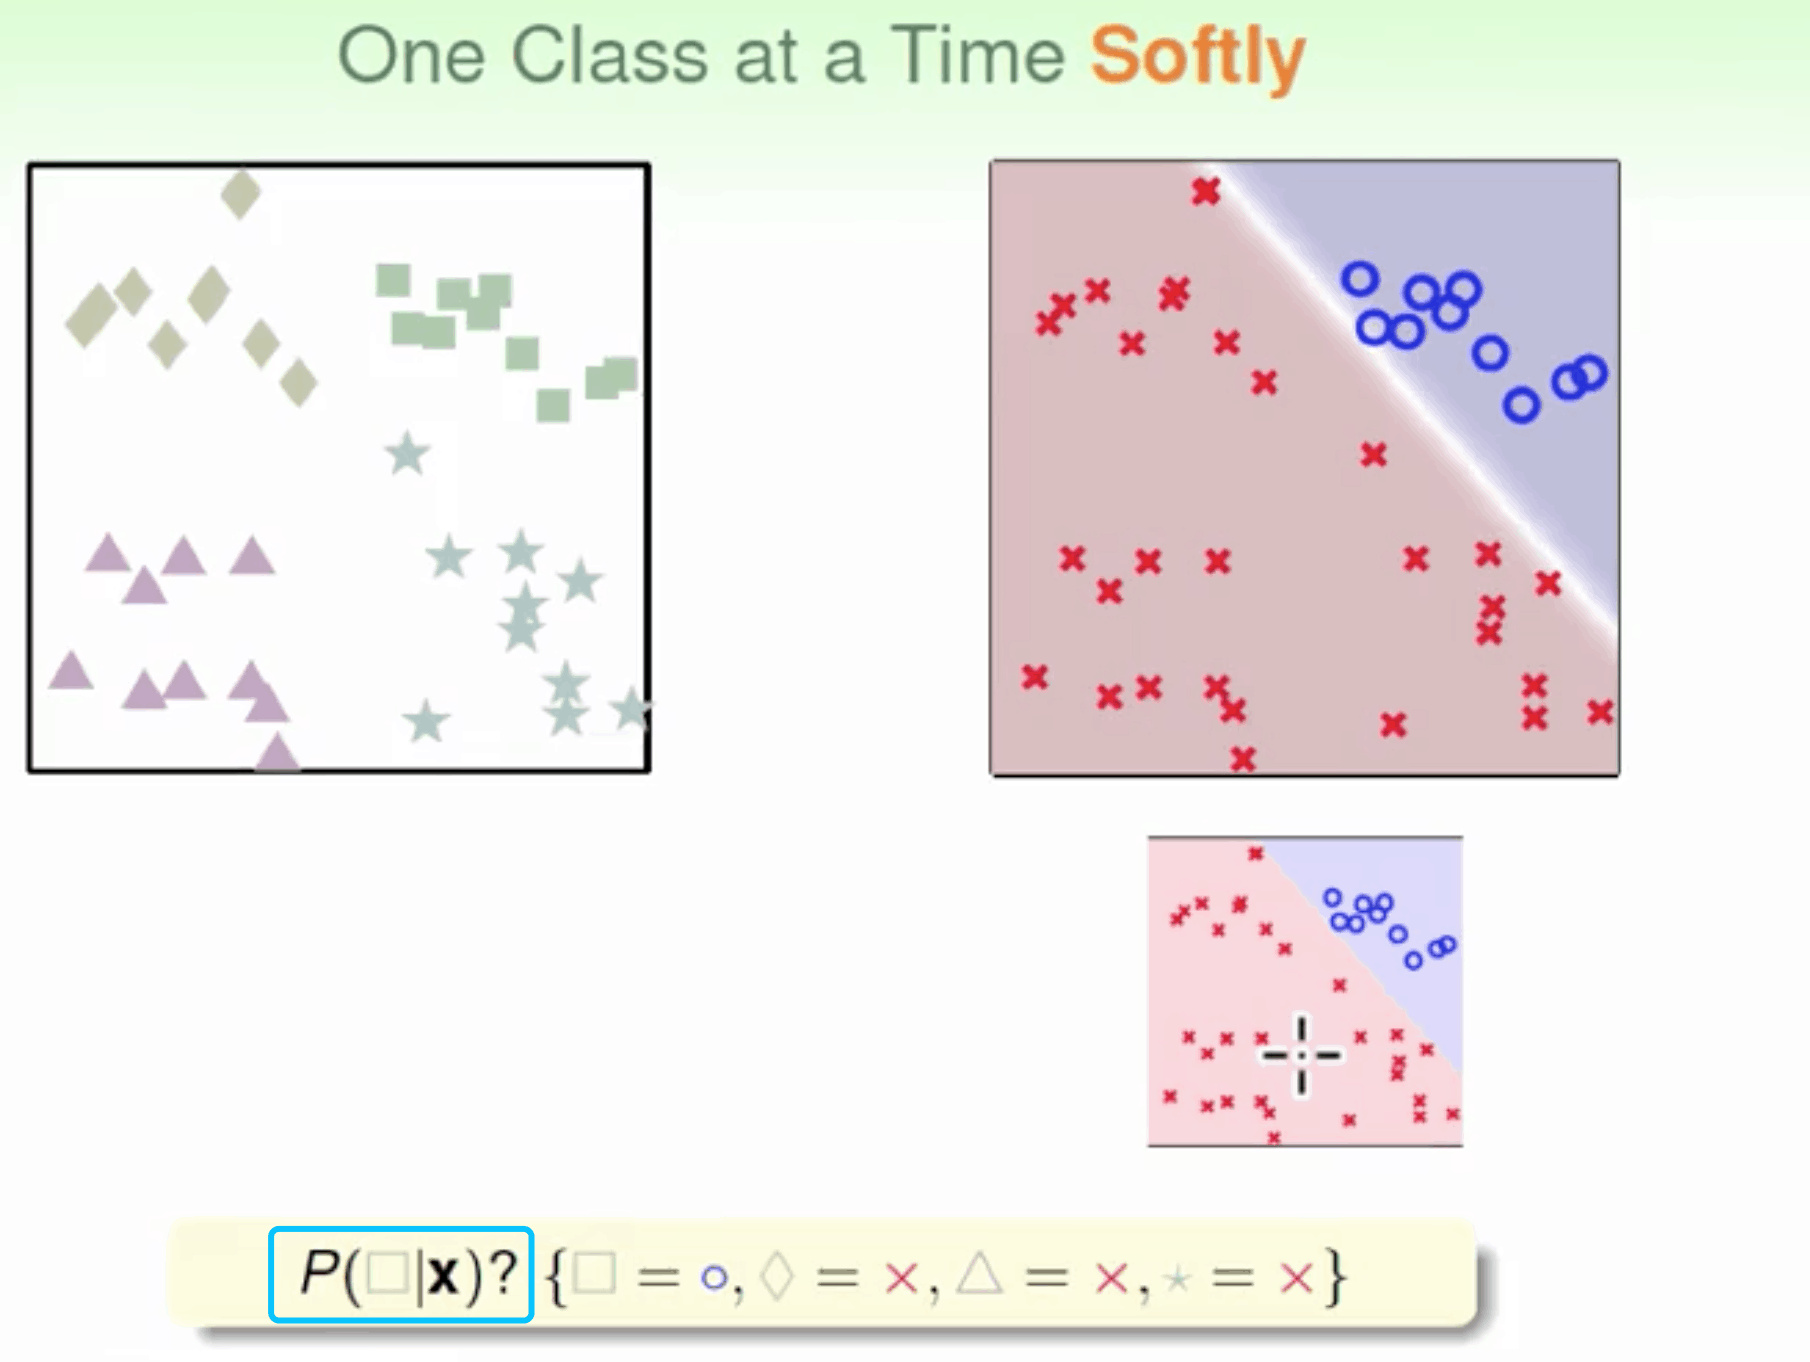
perform multiclass classification using multiple binary classifiers
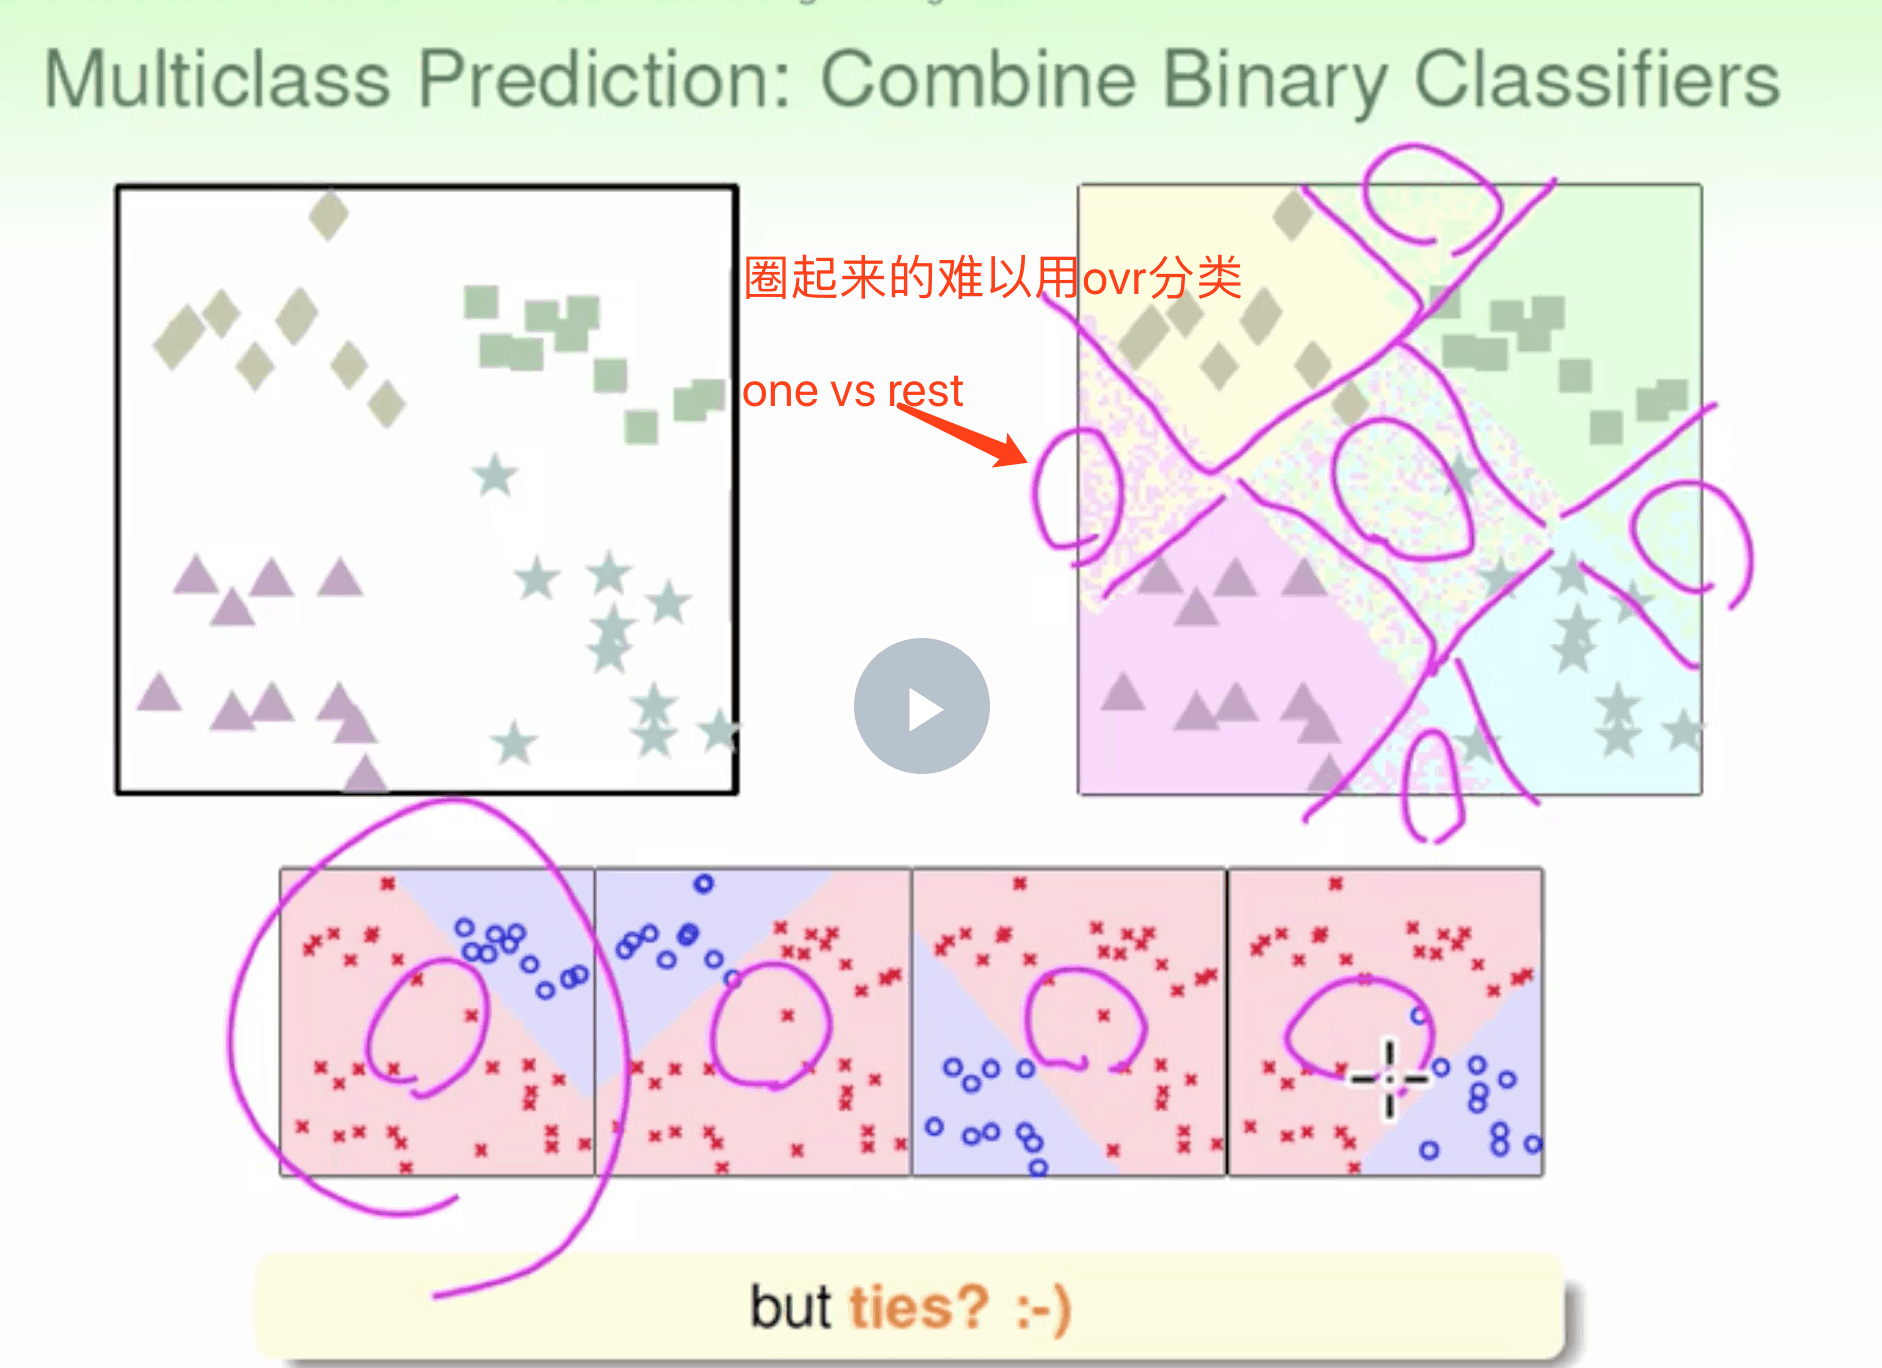
以上的判别方式难以处理多元分类 太硬了 不灵活
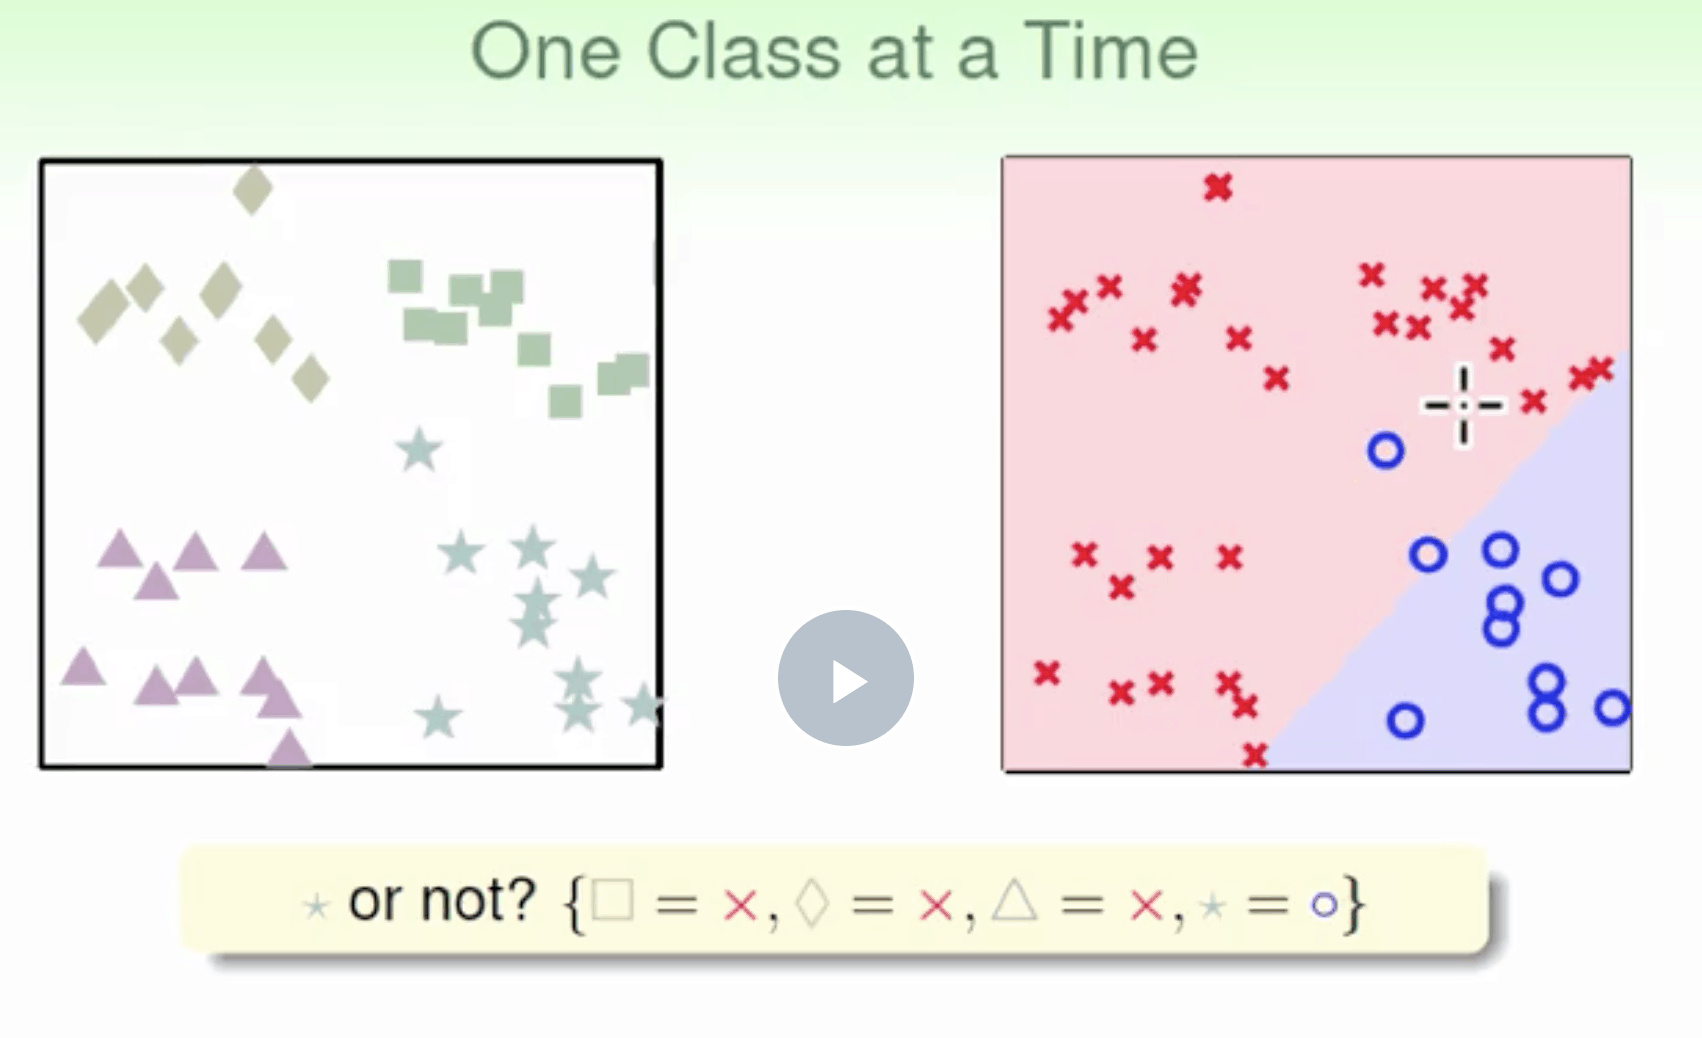
OVR
二元分类 One-Versus-Rest(OVR)
n class fn(d)-> if n for d in data select max(fn(d))
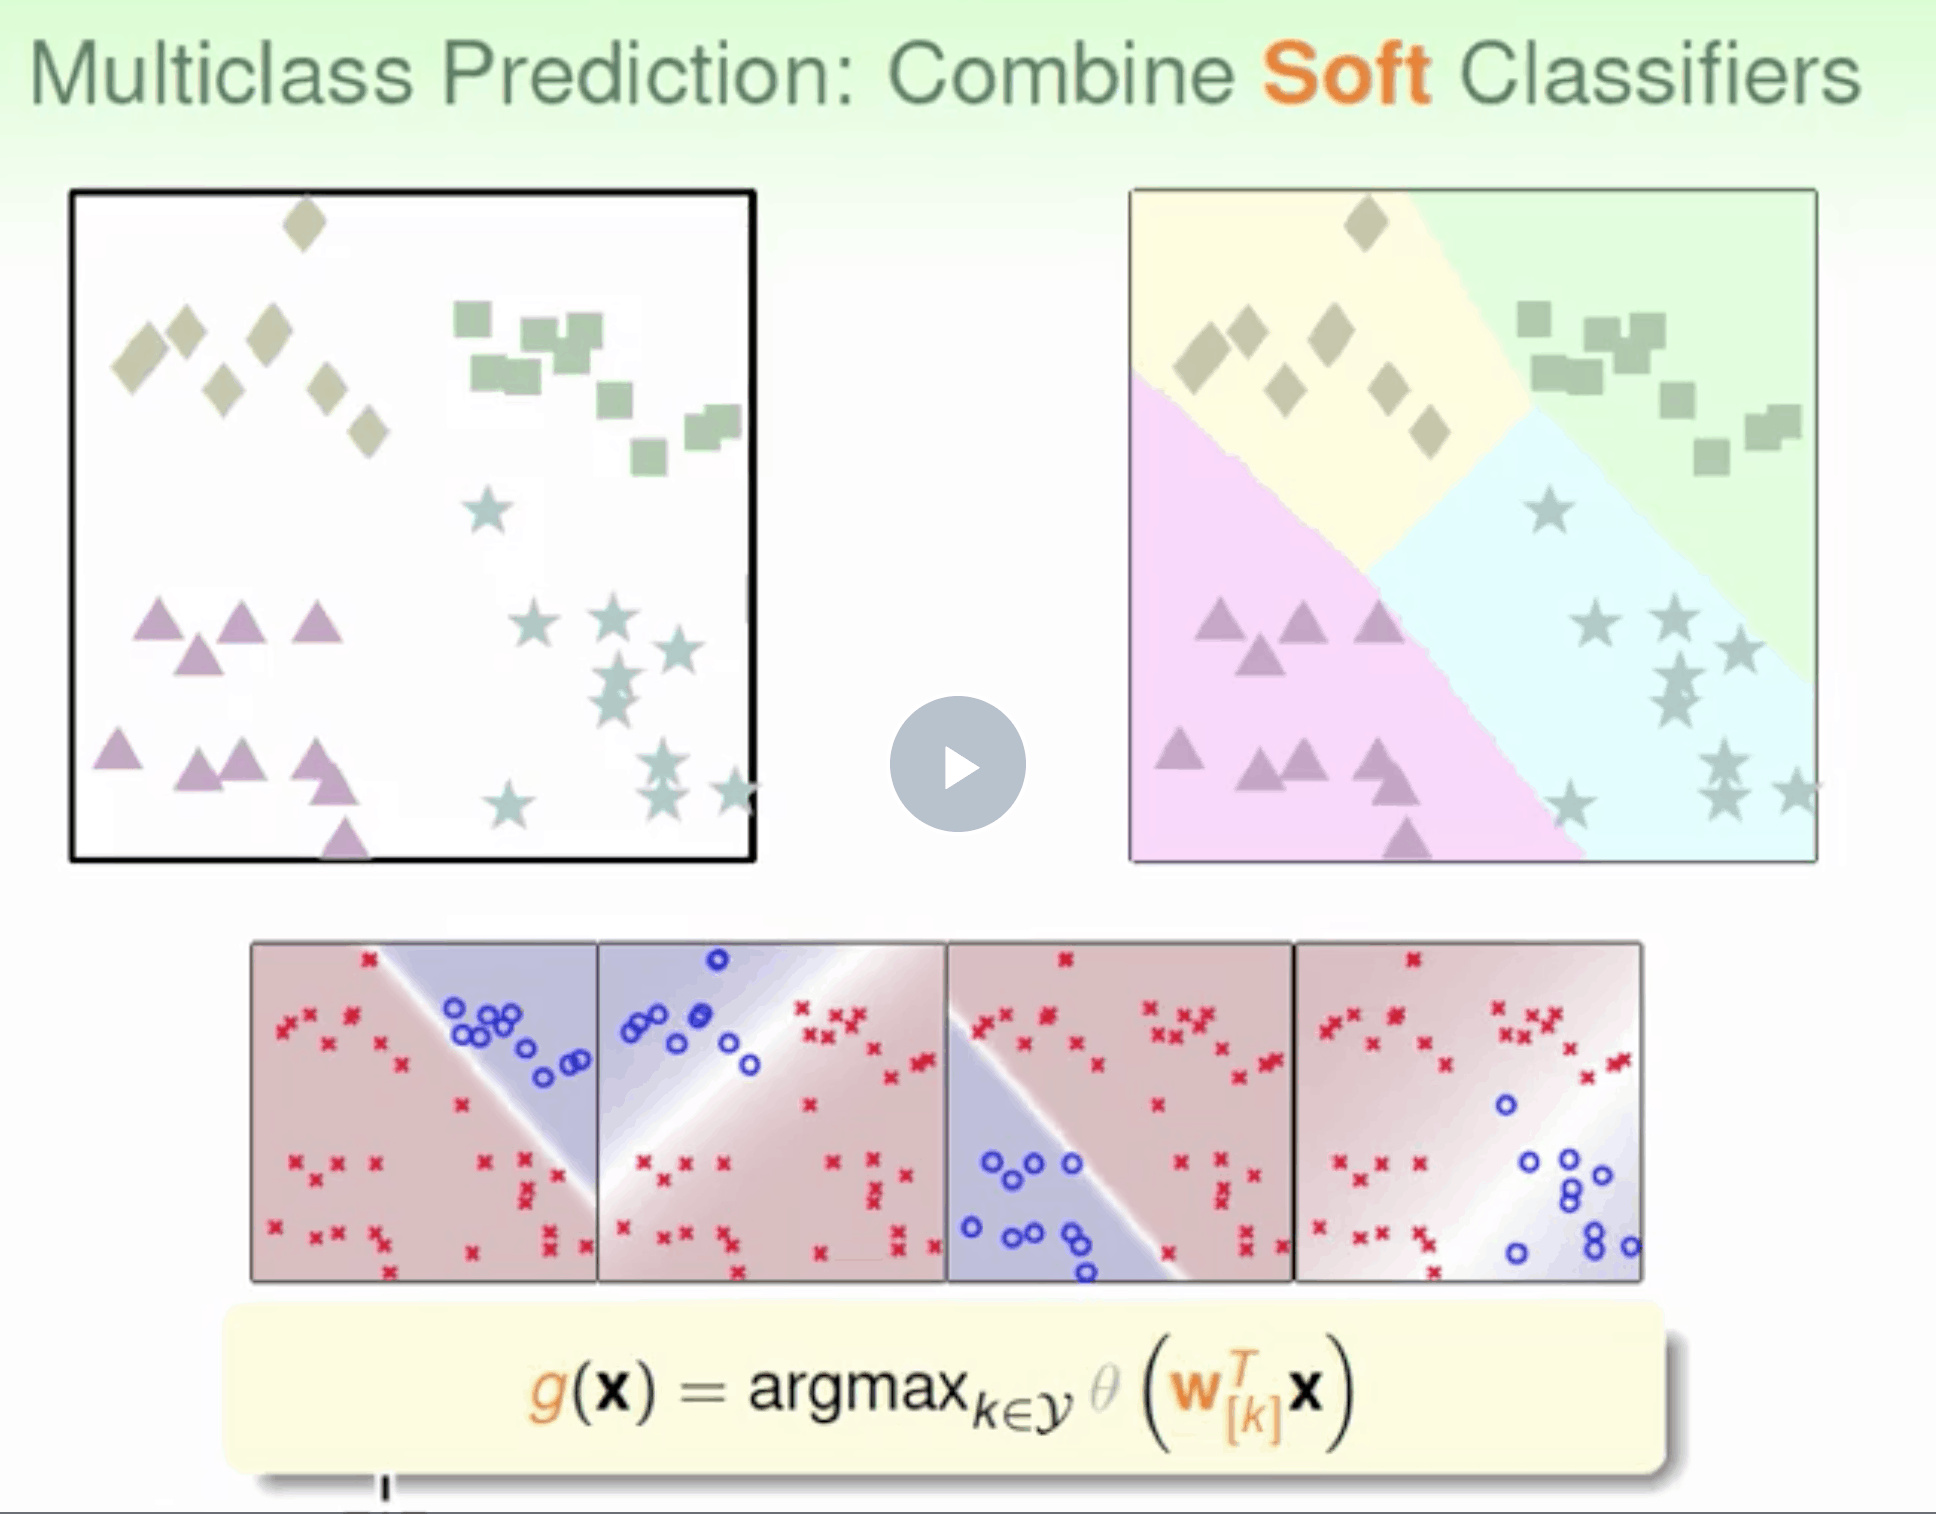
优点是简单高效 缺点是如果数据类别很多时,正负类之间的数量差别就很大(数据unbalanced),这样会影响分类效果
OVO
二元分类 每组二元分类 N × (N – 1) / 2 classifiers ,遍历所有二元分类配对 算出最高票
投票

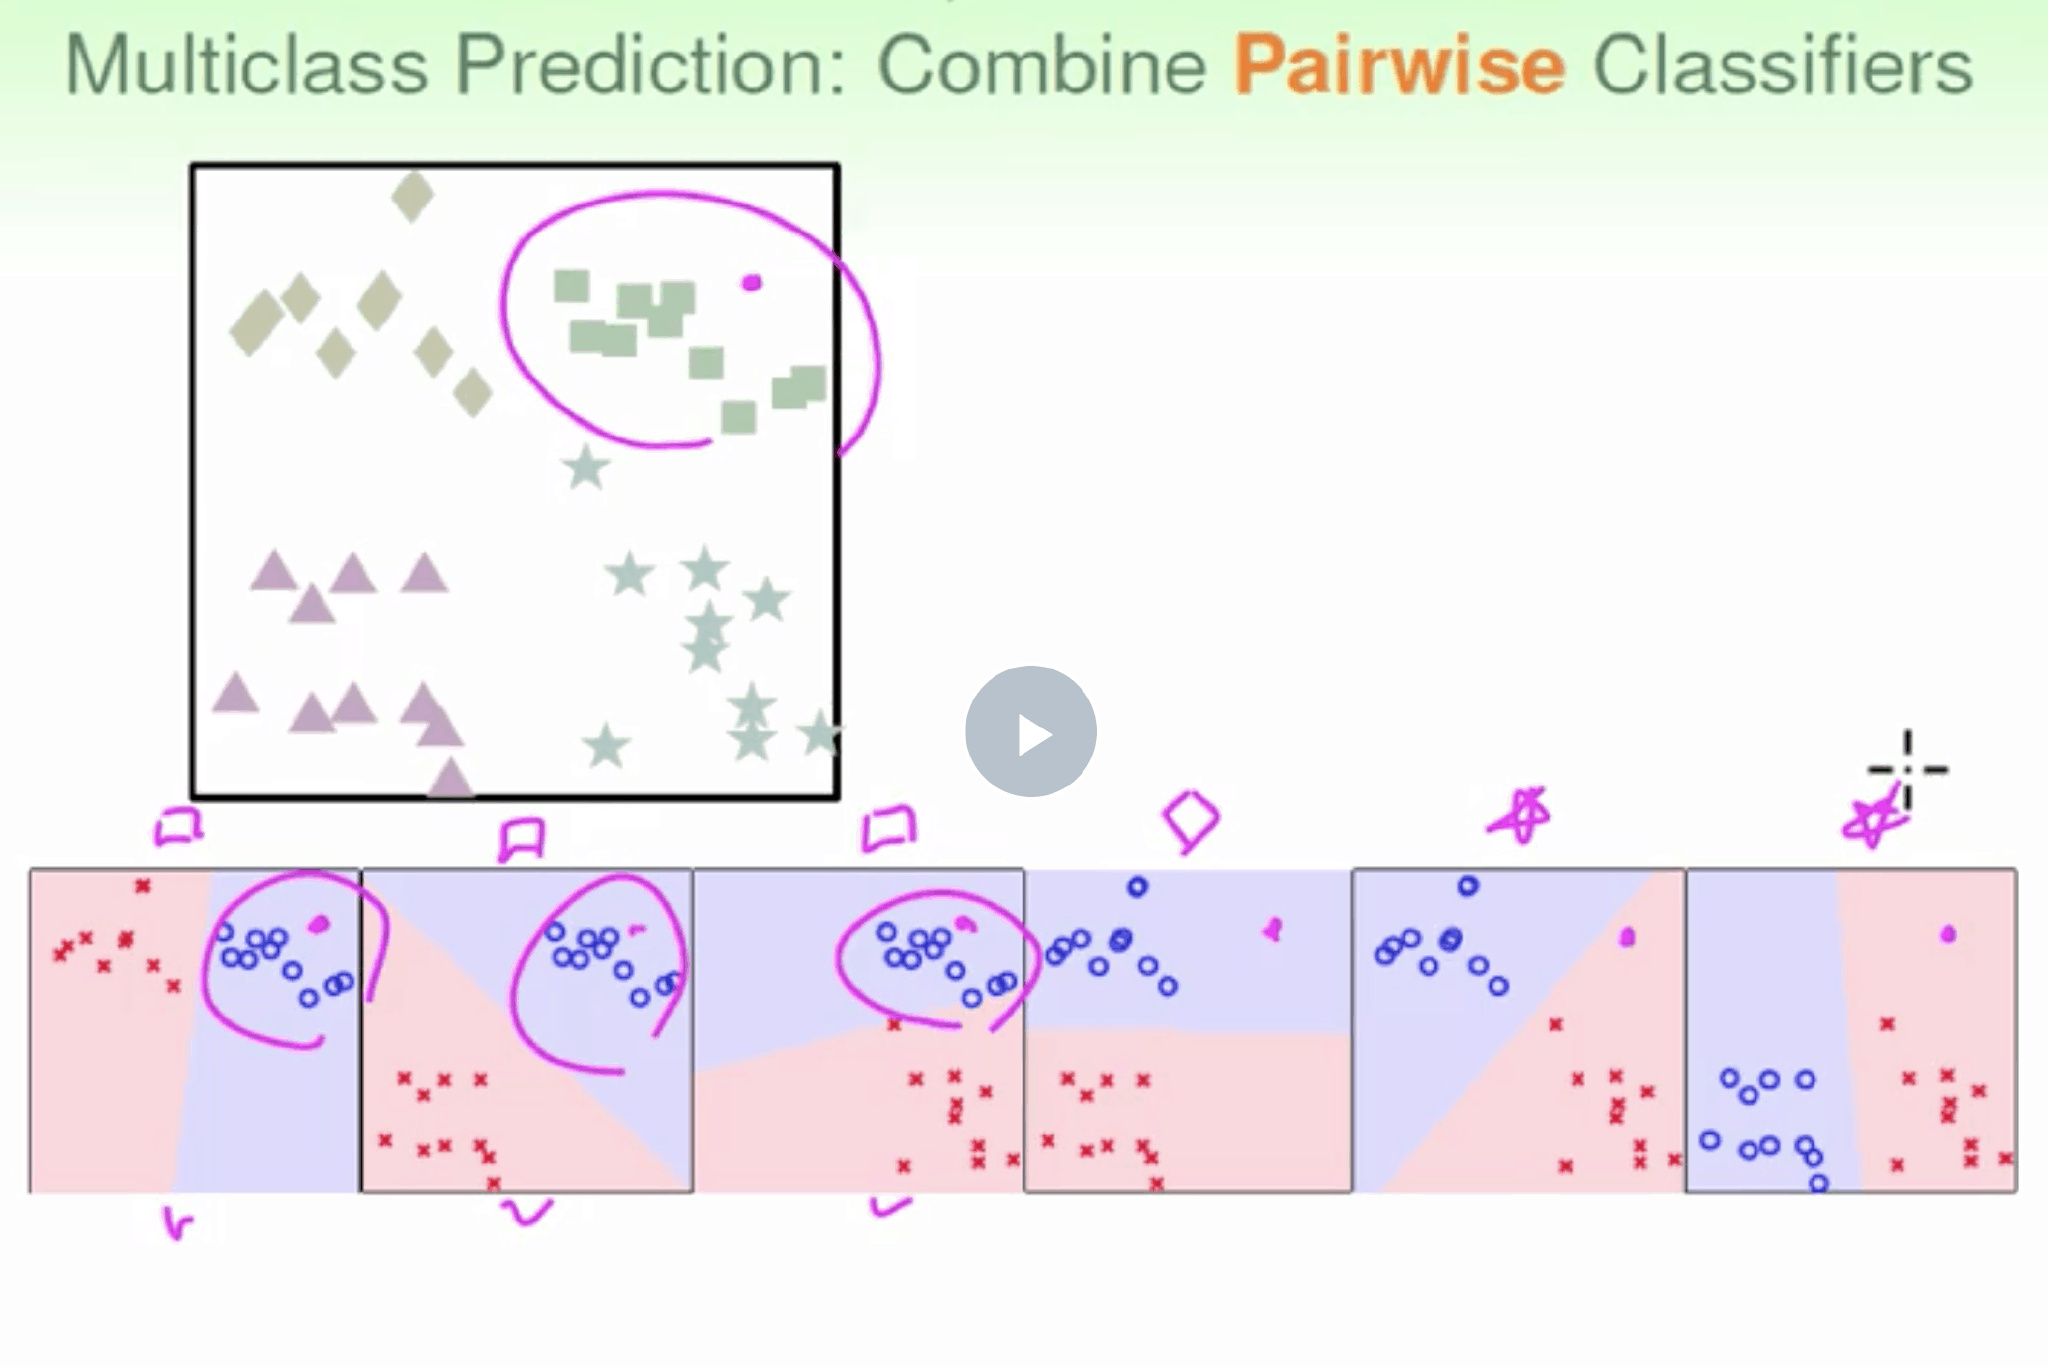
优点是更加高效,虽然分类次数增加,但是比较时数据量减少只使用两个类别的数据。而且一般不会出现数据unbalanced的情况。 缺点是需要分类的次数多$C_k^2$个,时间复杂度>空间复杂度
一般用OVR 小训练集上训练许多分类器比在大训练集上训练少量分类器更快 however, OVR is preferred Scikit-Learn detects when you try to use a binary classification algorithm for a multi‐class classification task, and it automatically runs OVR
1 | |
多元混淆矩阵
多分类问题,这就意味着每两两类别的组合都对应一个二元的混淆矩阵。
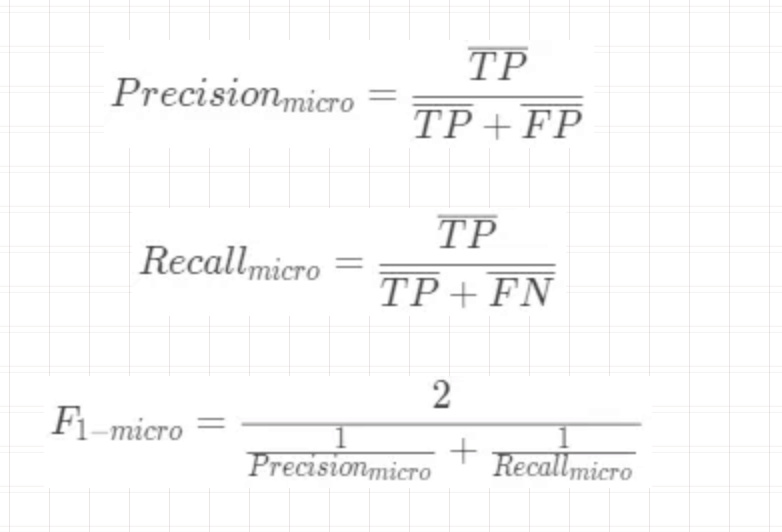
- 先在各个混淆矩阵中分别计算出结果,再计算平均值,这种方式称为宏平均。
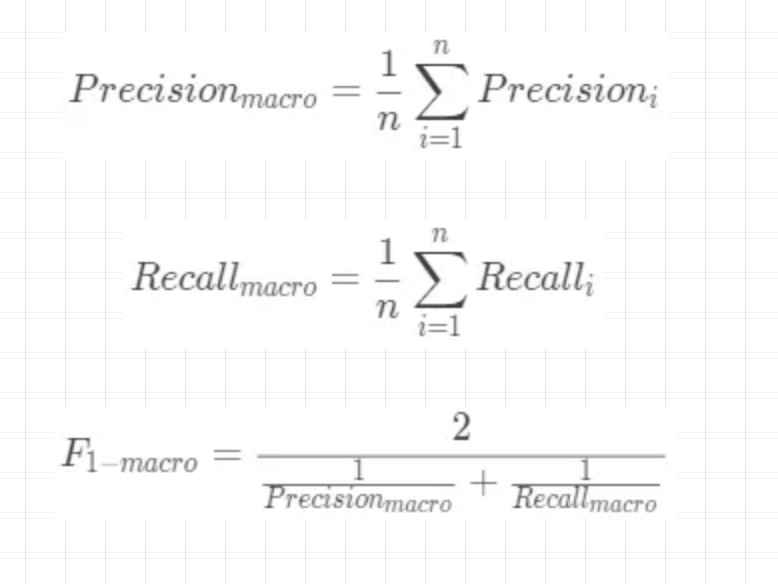
- 二元混淆矩阵的对应的元素进行平均,得到 TP、TN、FP、FN 的平均值,然后再根据这些平均值来计算,这种方式称为微平均
多标签分类
一个样例输出多个类别,比如对于同一张图片,它识别出几个人
1 | |
类别不平衡 class-imbalance
当面对不平衡的数据集时,机器学习算法倾向于产生不令人满意的分类器。 在数据分析过程中面临的主要问题是-如何通过为这些异常获取大量样本来获得平衡数据集?,因为它们很少发生。 当面对不平衡的数据集时,传统的模型评估方法不能准确地测量模型性能。往往只预测majority class数据。 minority class被视为噪音,往往被忽视。因此,与majority class相比,minority class错误分类概率很高。
imbalanced-classification-problem 8 Tactics to Combat Imbalanced Classes in Your Machine Learning Dataset
重采样
增加少数群体的频率或降低多数群体的频率
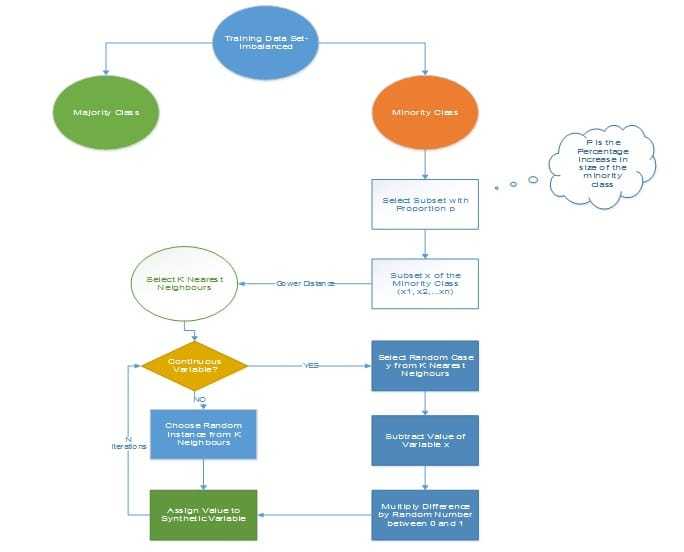
SMOTE
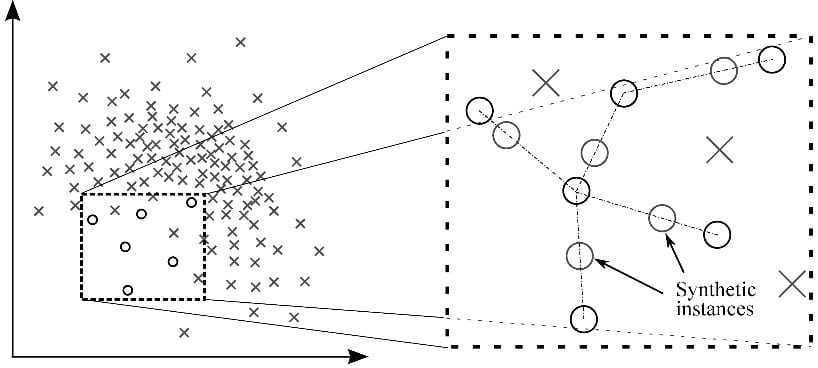
Synthetic Minority Over-sampling Technique
遵循该技术以避免在将少数例子的精确复制品添加到主数据集时发生的过度拟合。从少数类中获取数据子集作为示例,然后创建新的合成类似实例。然后将这些合成实例添加到原始数据集中。新数据集用作训练分类模型的样本。
MSMOTE
SMOTE 改进版 通过计算少数类样本和训练数据样本之间的距离 将少数类分成三组 – Security/Safe samples, Border samples, and latent nose samples.
安全样本是那些可以改善分类器性能的数据点。另一方面,噪声是可能降低分类器性能的数据点。难以归类为两者中任何一个的那些被归类为边界样本。
集成算法
修改现有的分类算法,使其适用于不平衡的数据集
在大多数情况下,SMOTE和MSMOTE等合成技术的性能将优于传统的过采样和欠采样方法。 为了获得更好的效果,可以使用合成采样方法,如SMOTE和MSMOTE,以及先进的增强方法,如渐变增强和XG增强。
更改性能指标
准确性不是使用不平衡数据集时使用的度量标准。我们已经看到它具有误导性。